Ampere meter mode, current and power measurements of embedded devices
In-line current and power measurements
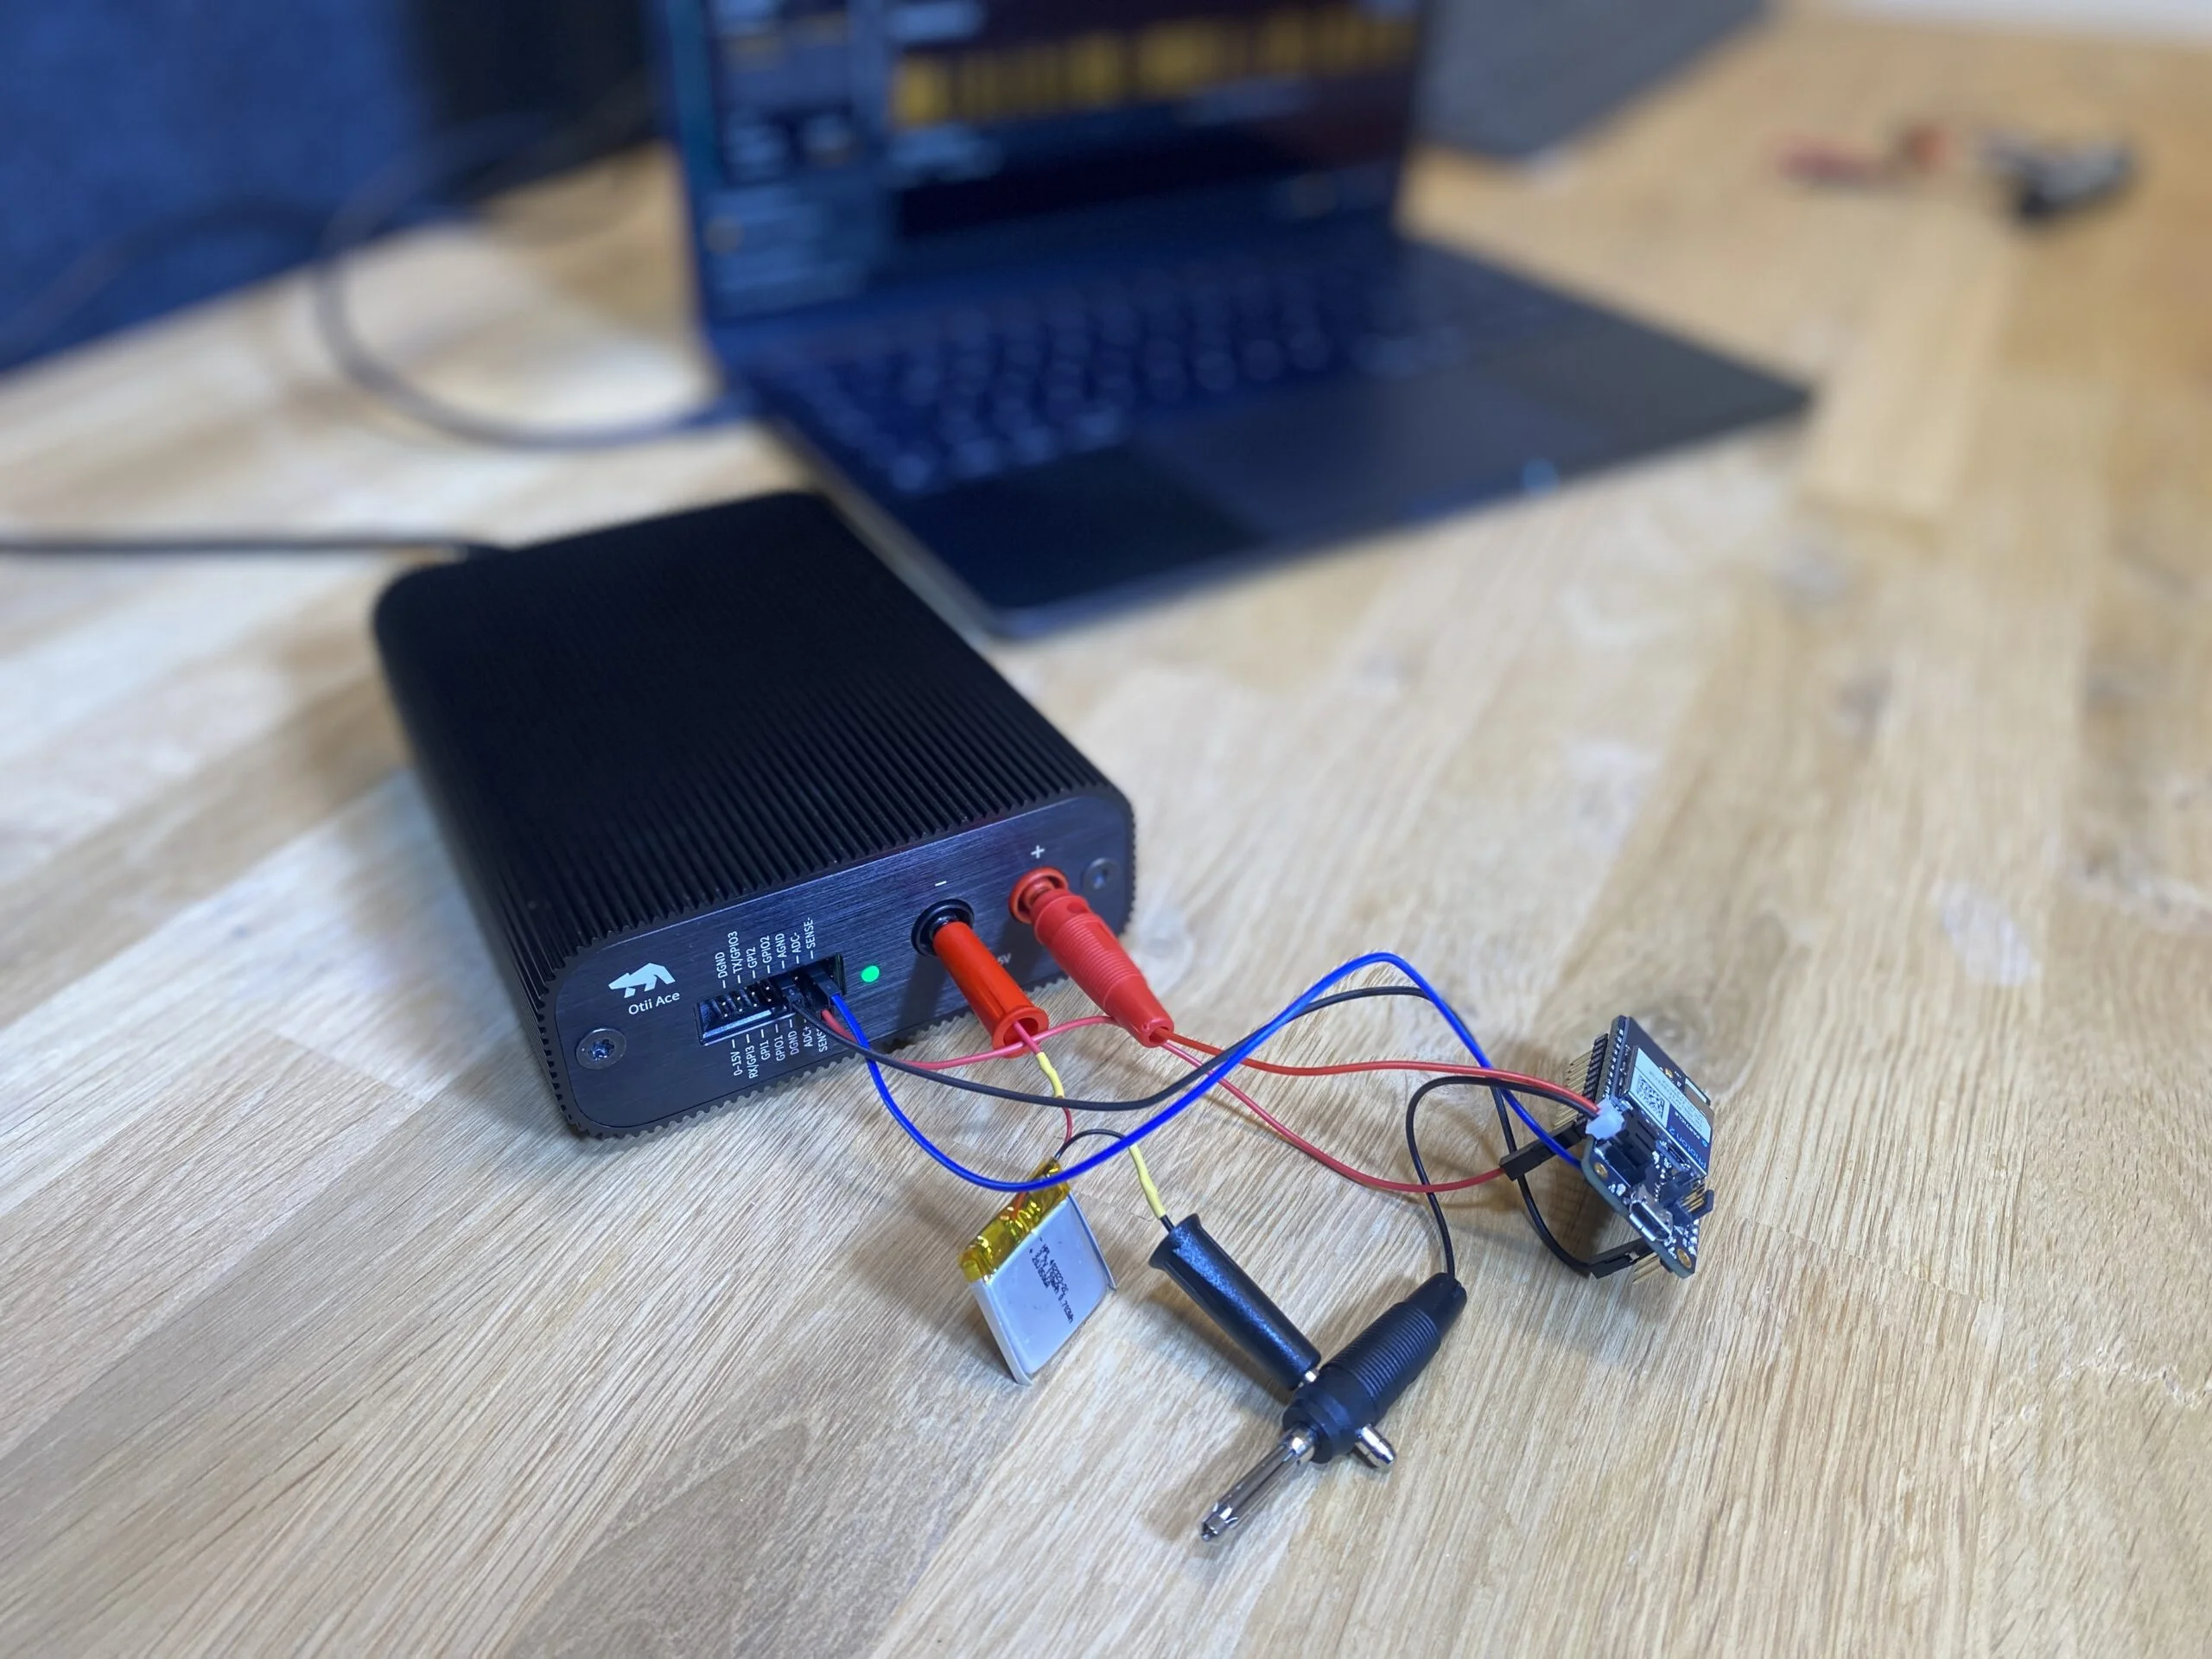
This setup works with Otii Ace. Otii Ace acts like an ampere meter, connected via main connectors in line between the power source and the device under test (DUT). Positive current is current that flows out of the banana + connector. The power source in the setup can be any relevant source for embedded devices, for example, a battery or solar energy harvesting panel.
Note that in this setup you can choose to have only the current consumption measured or to also have voltage, power and energy measured. To measure additional voltage, power and energy the setup is extended with 4-wire connection using SENSE pins in the expansion ports of the Ace.
Products needed
How to connect
- Connect Ace to your computer by USB. If needed add a power supply.
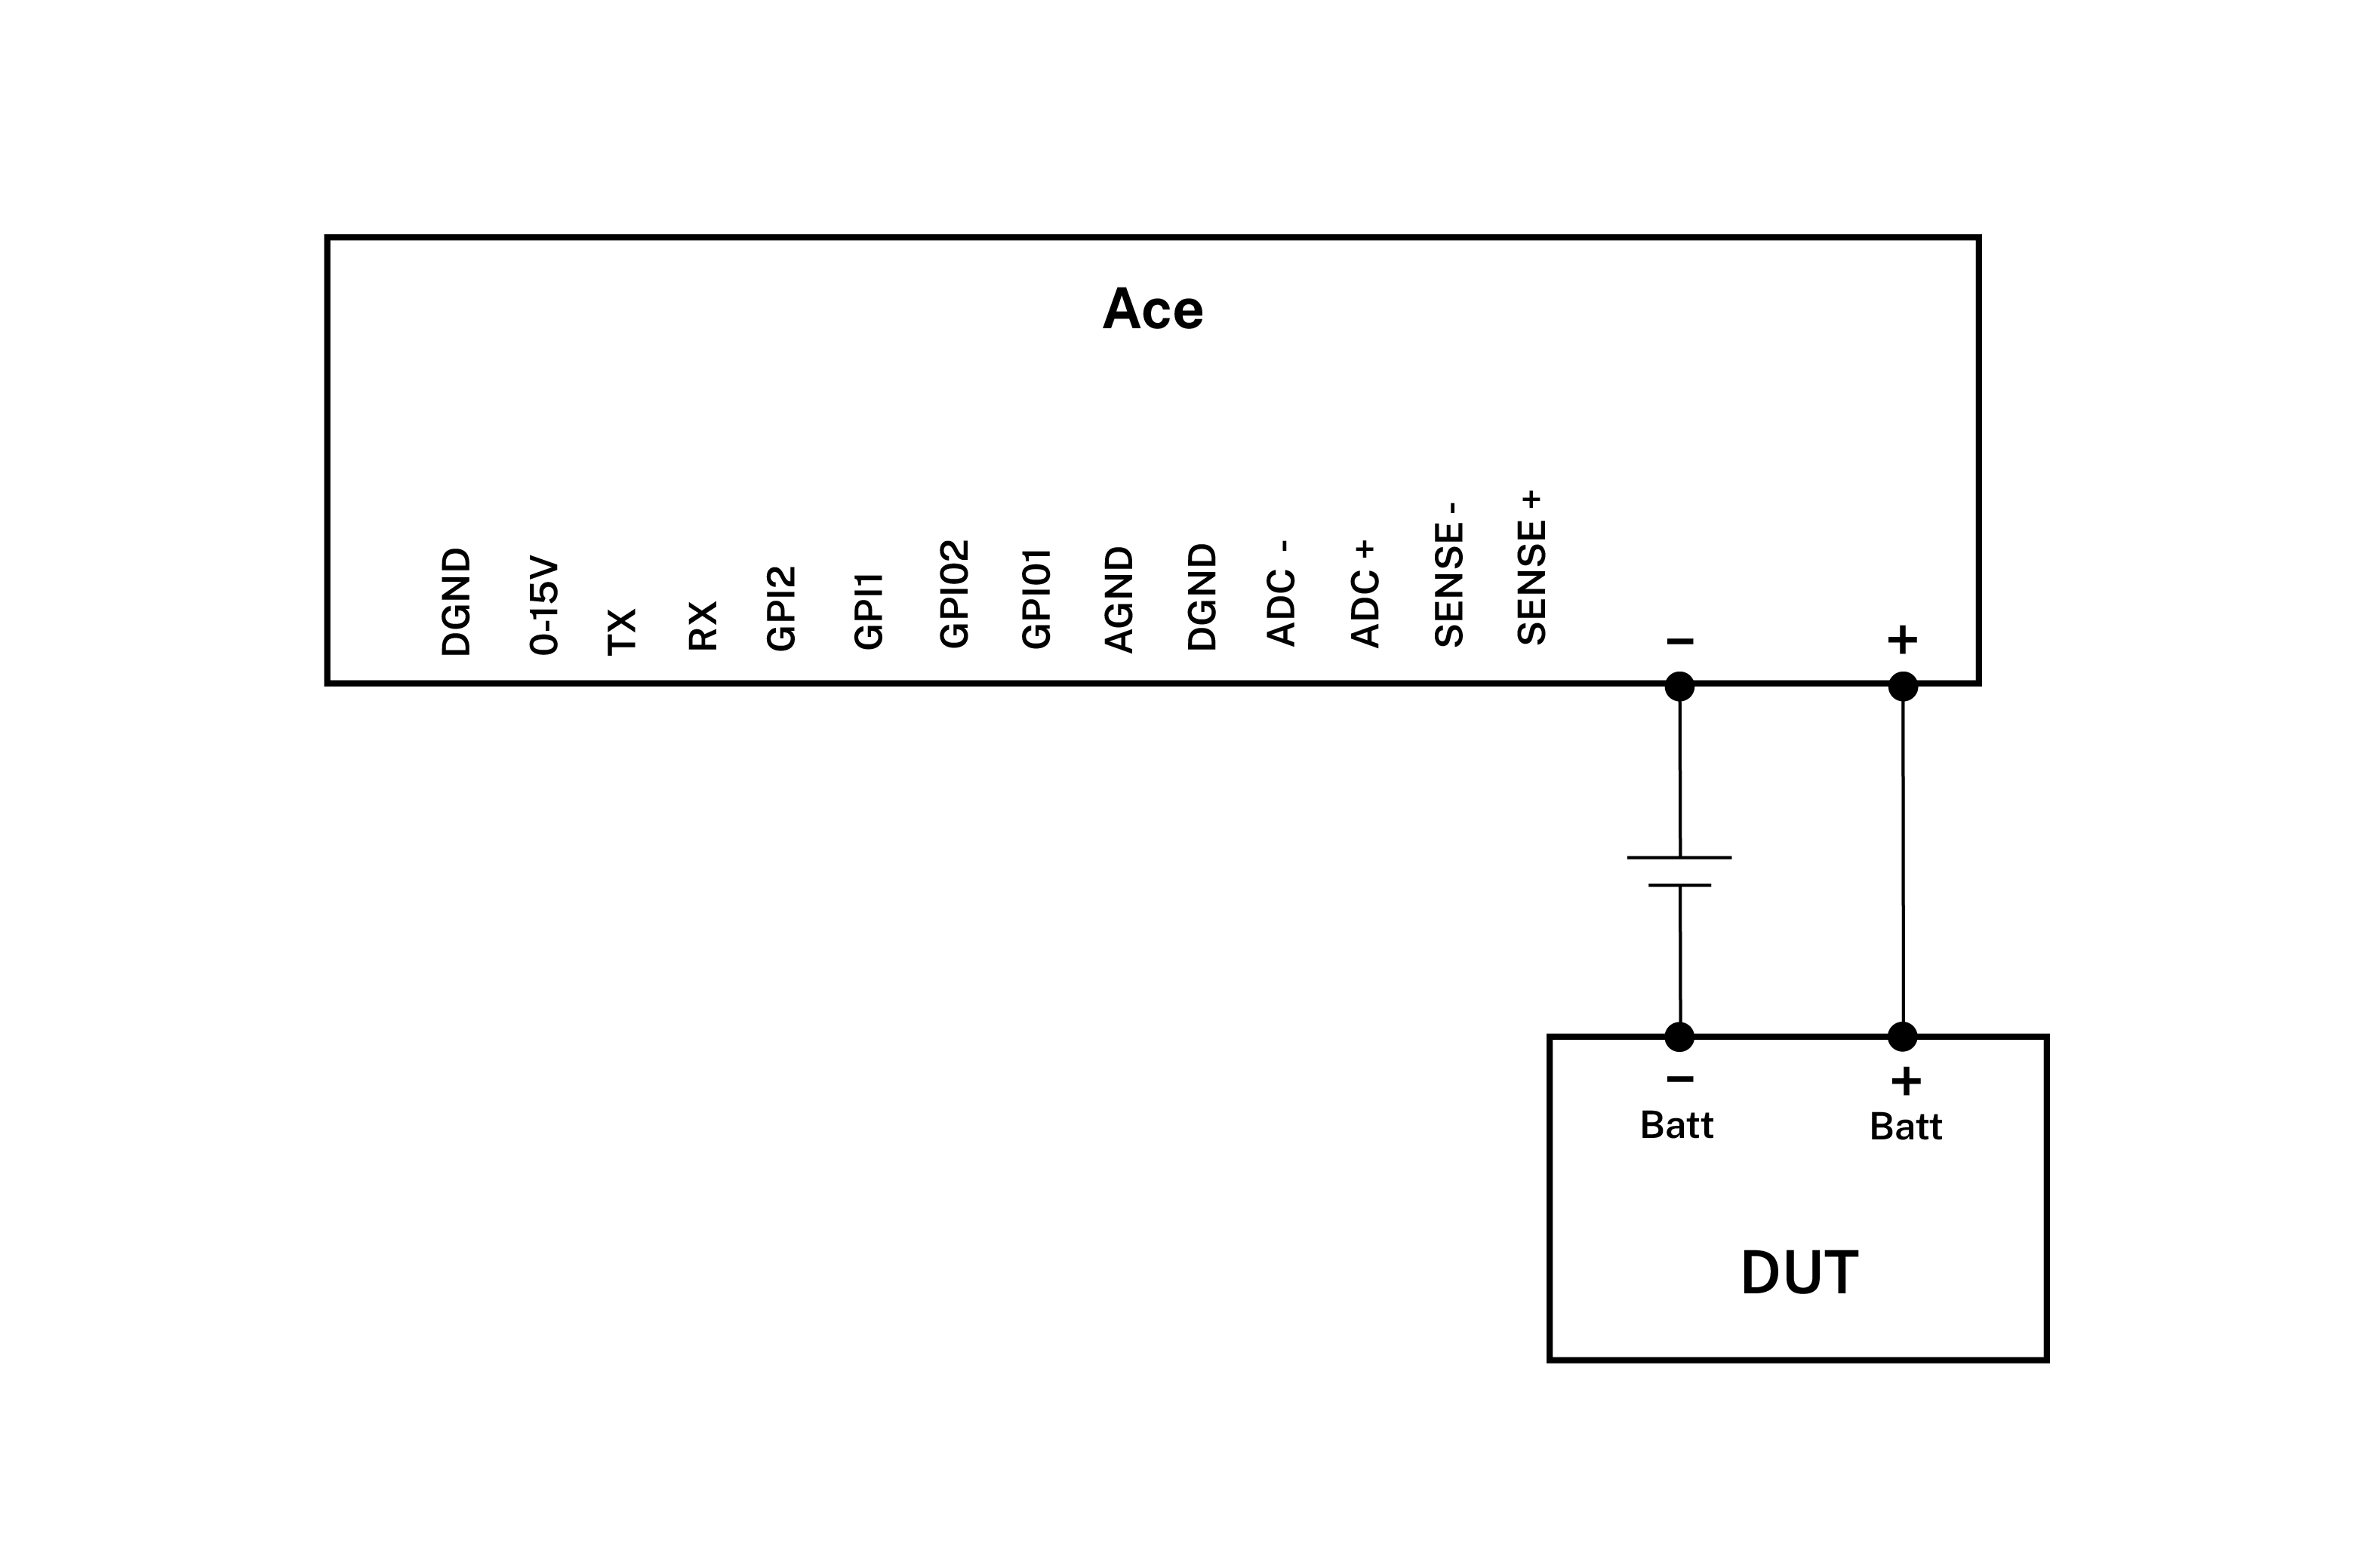
- Connect Ace’s banana connector + to DUT positive battery connector/power connector.
- Connect Ace’s banana connector – to energy source positive pole.
- Connect DUT’s negative battery connector/power connector to energy source negative pole.
If you only want to measure current, you can proceed to the ‘Get started in the Otii app’. If current measurement alone is chosen, the voltage channel in the app, if enabled, will only display the voltage drop between banana connector + and banana connector -.
Schematic for in-line current measurements
If you also want to measure voltage, power and energy, then add this to the setup:
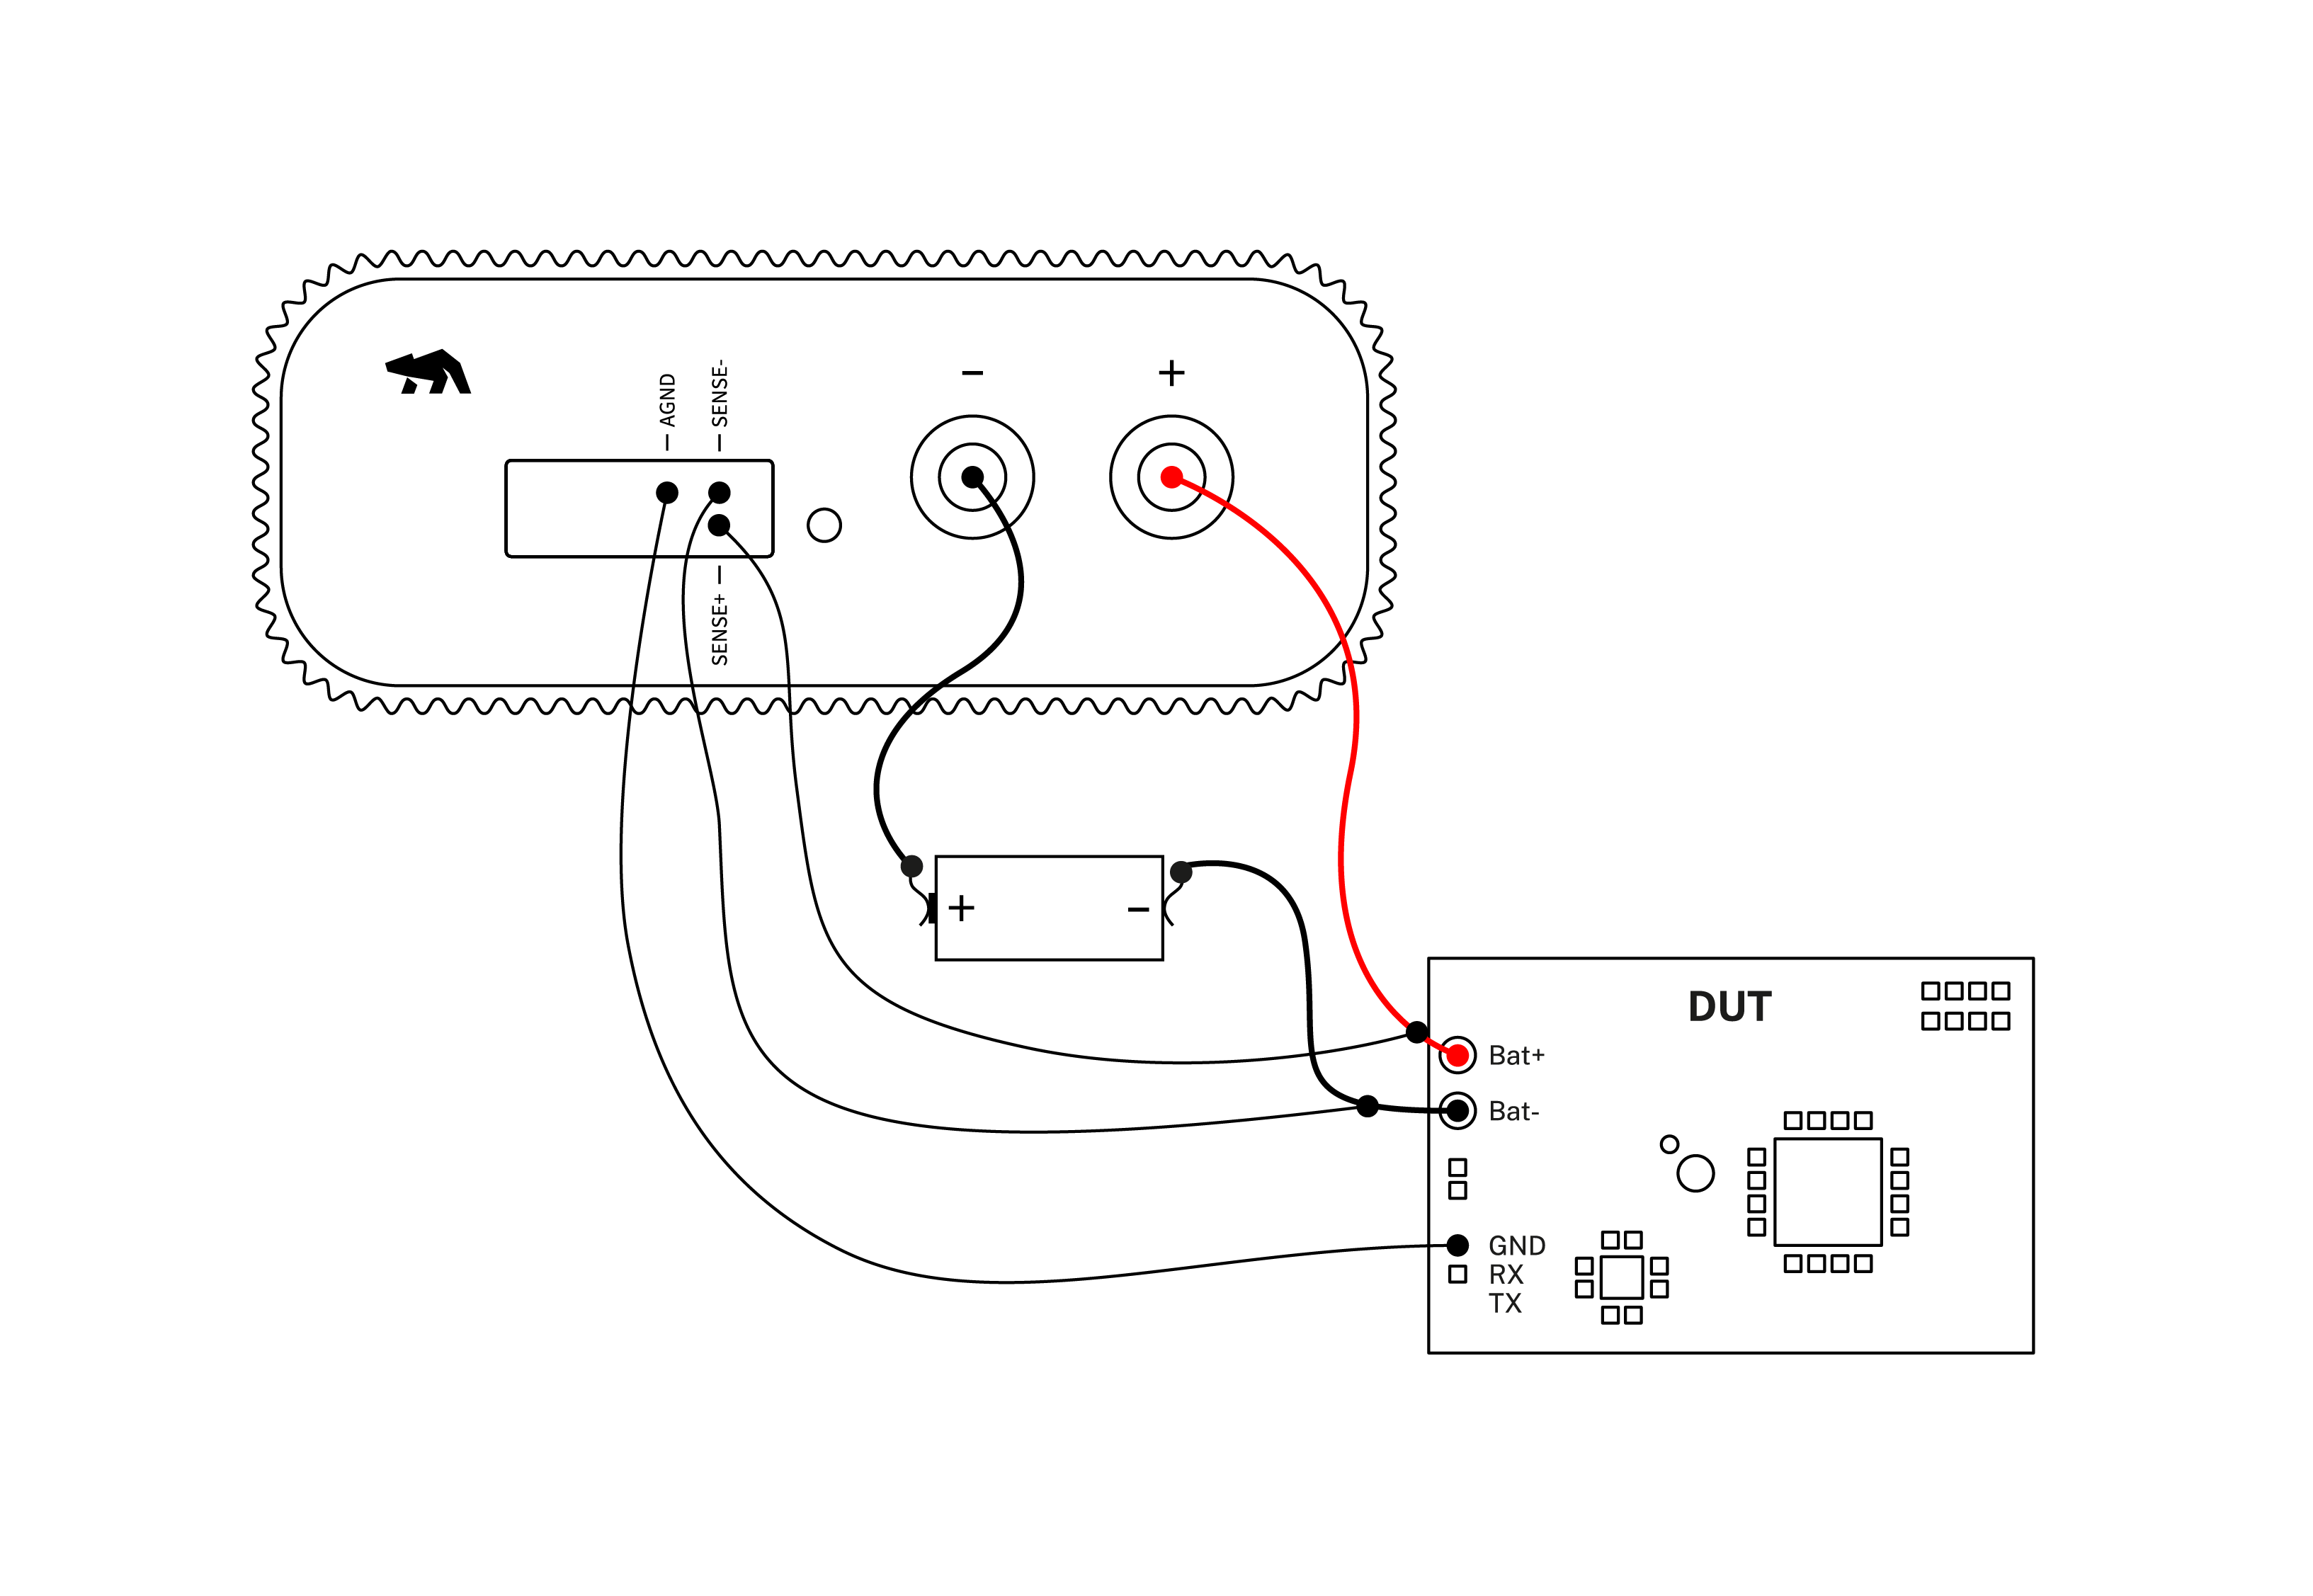
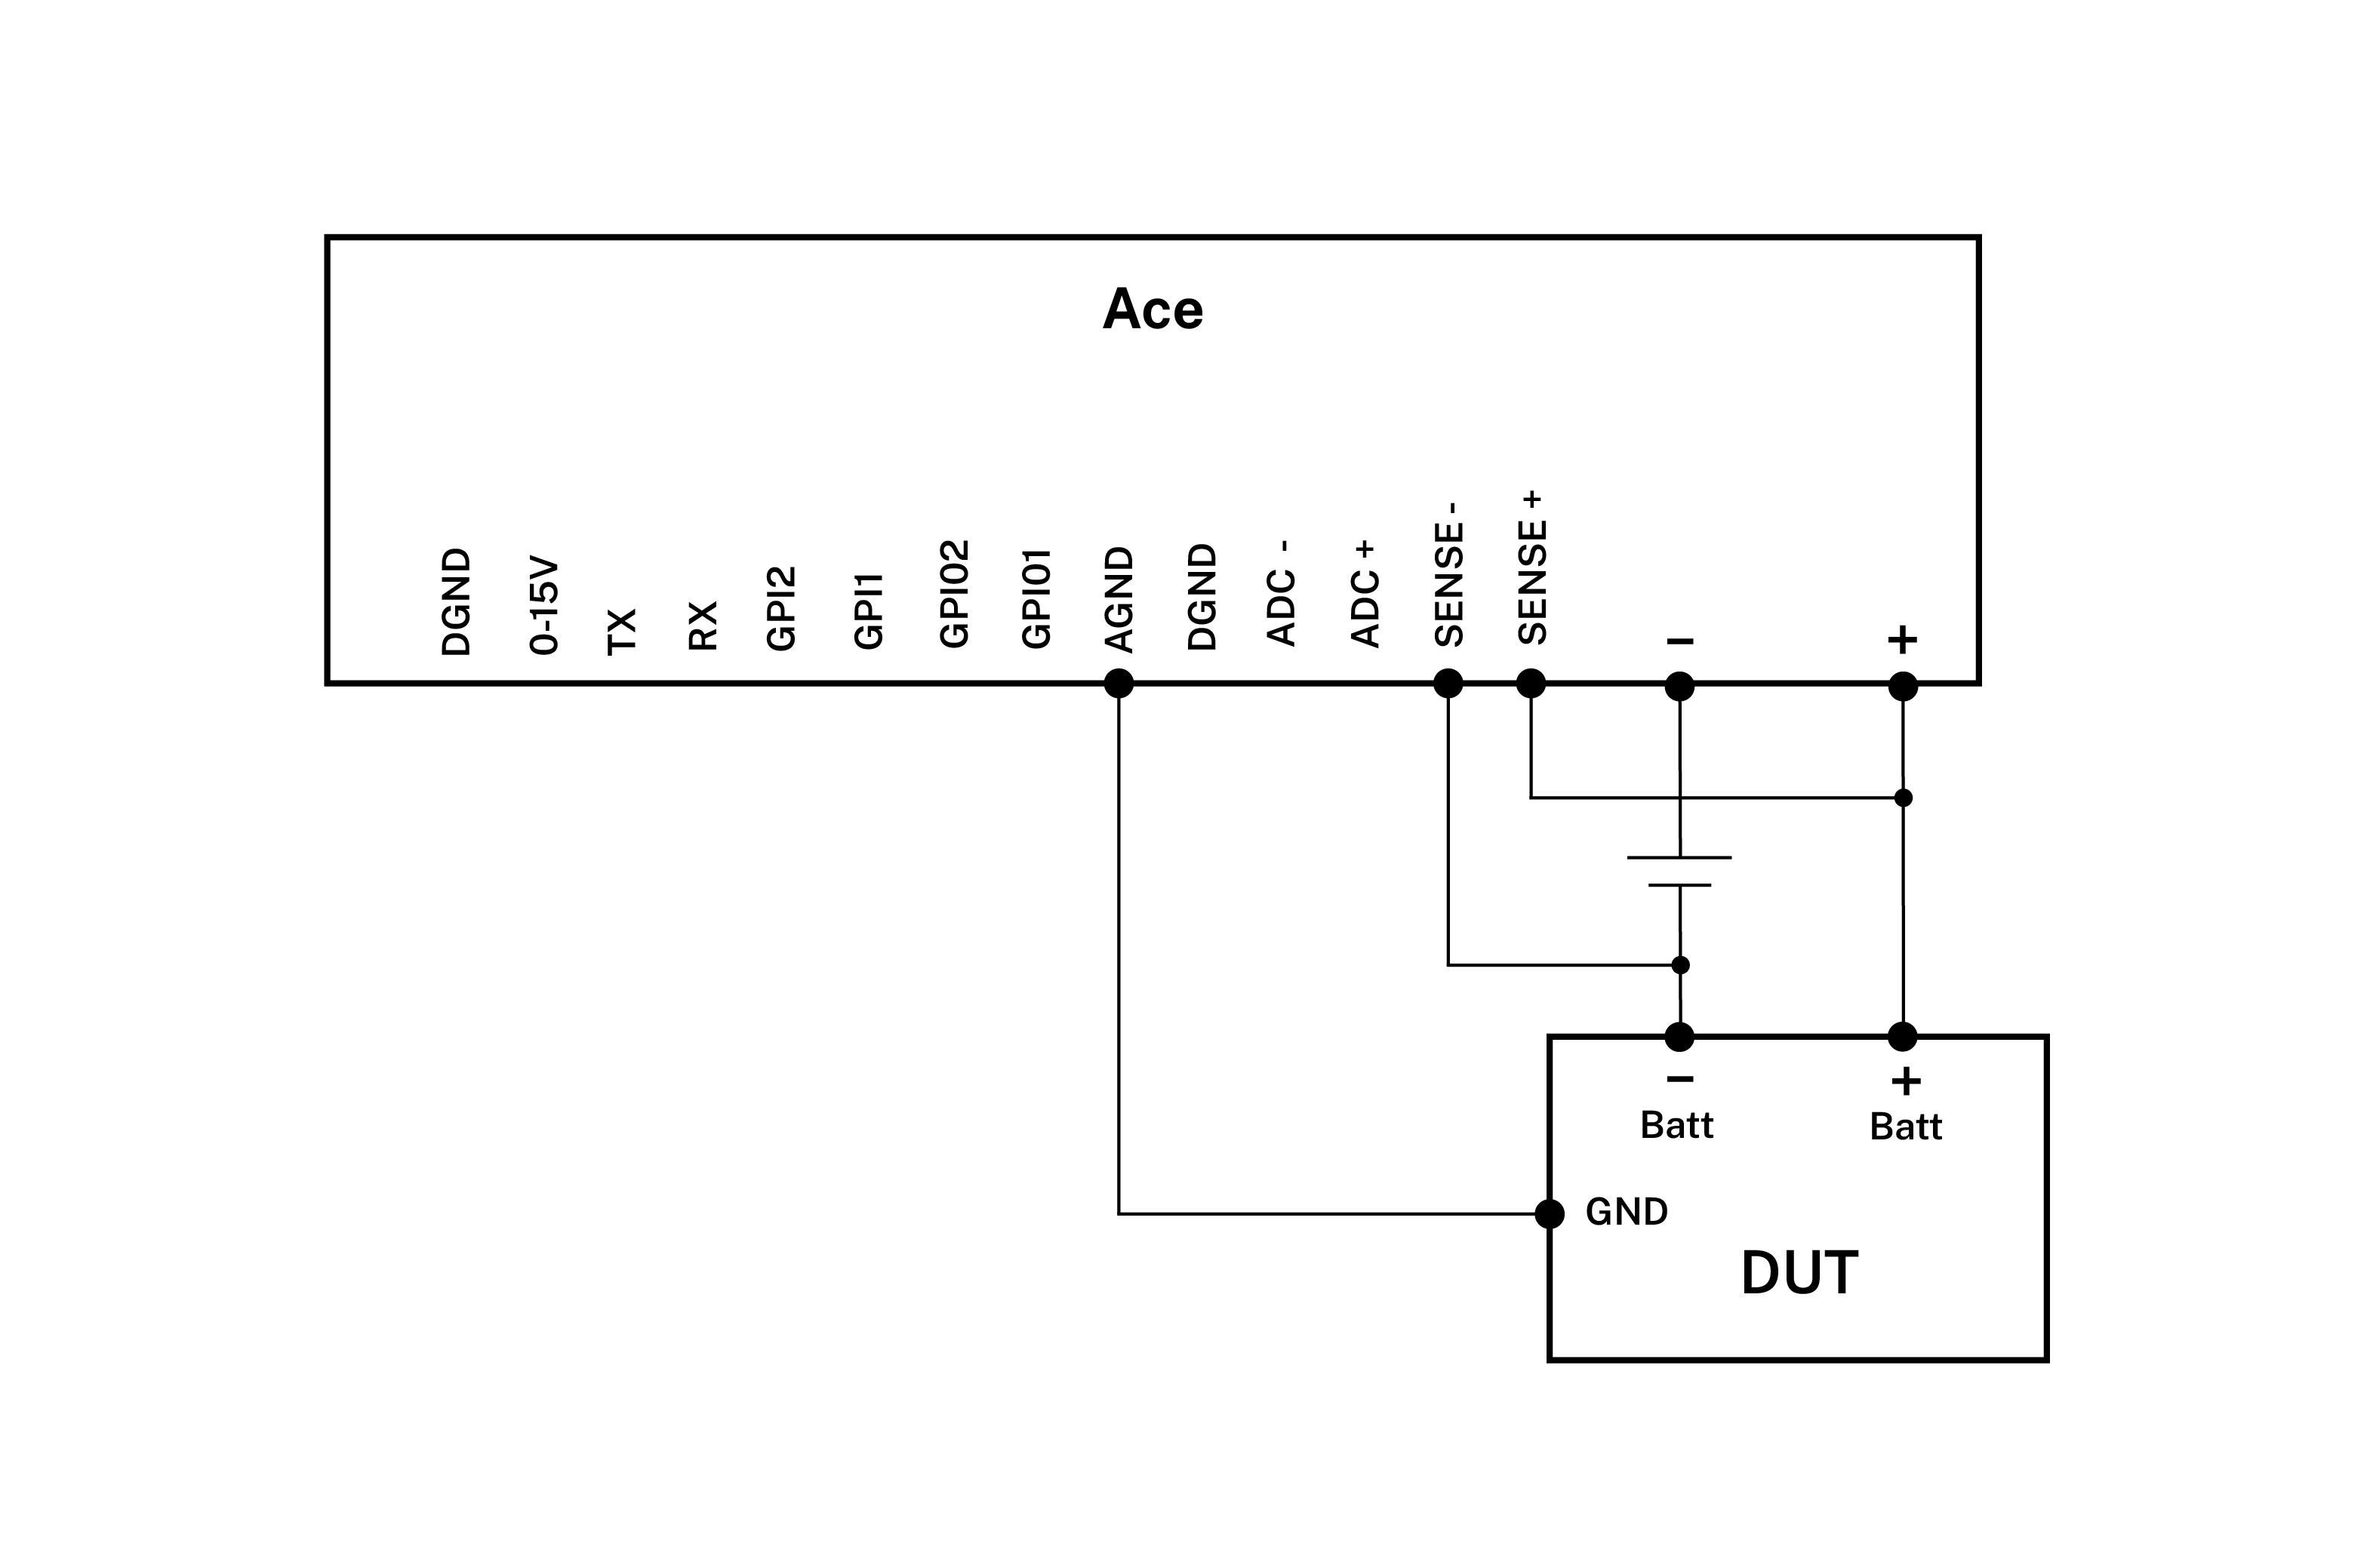
- Connect AGND to DUT’s GND
- Connect SENSE+ to DUT’s positive battery connector/power connector
- Connect SENSE- to DUT’s negative battery connector/power connector GND
This setup with SENSE pins is called 4-wire and it provides the voltage measurements between the SENSE pins in the expansion ports, which is used to calculate power and energy.
Schematic for in-line current, voltage, power and energy measurements
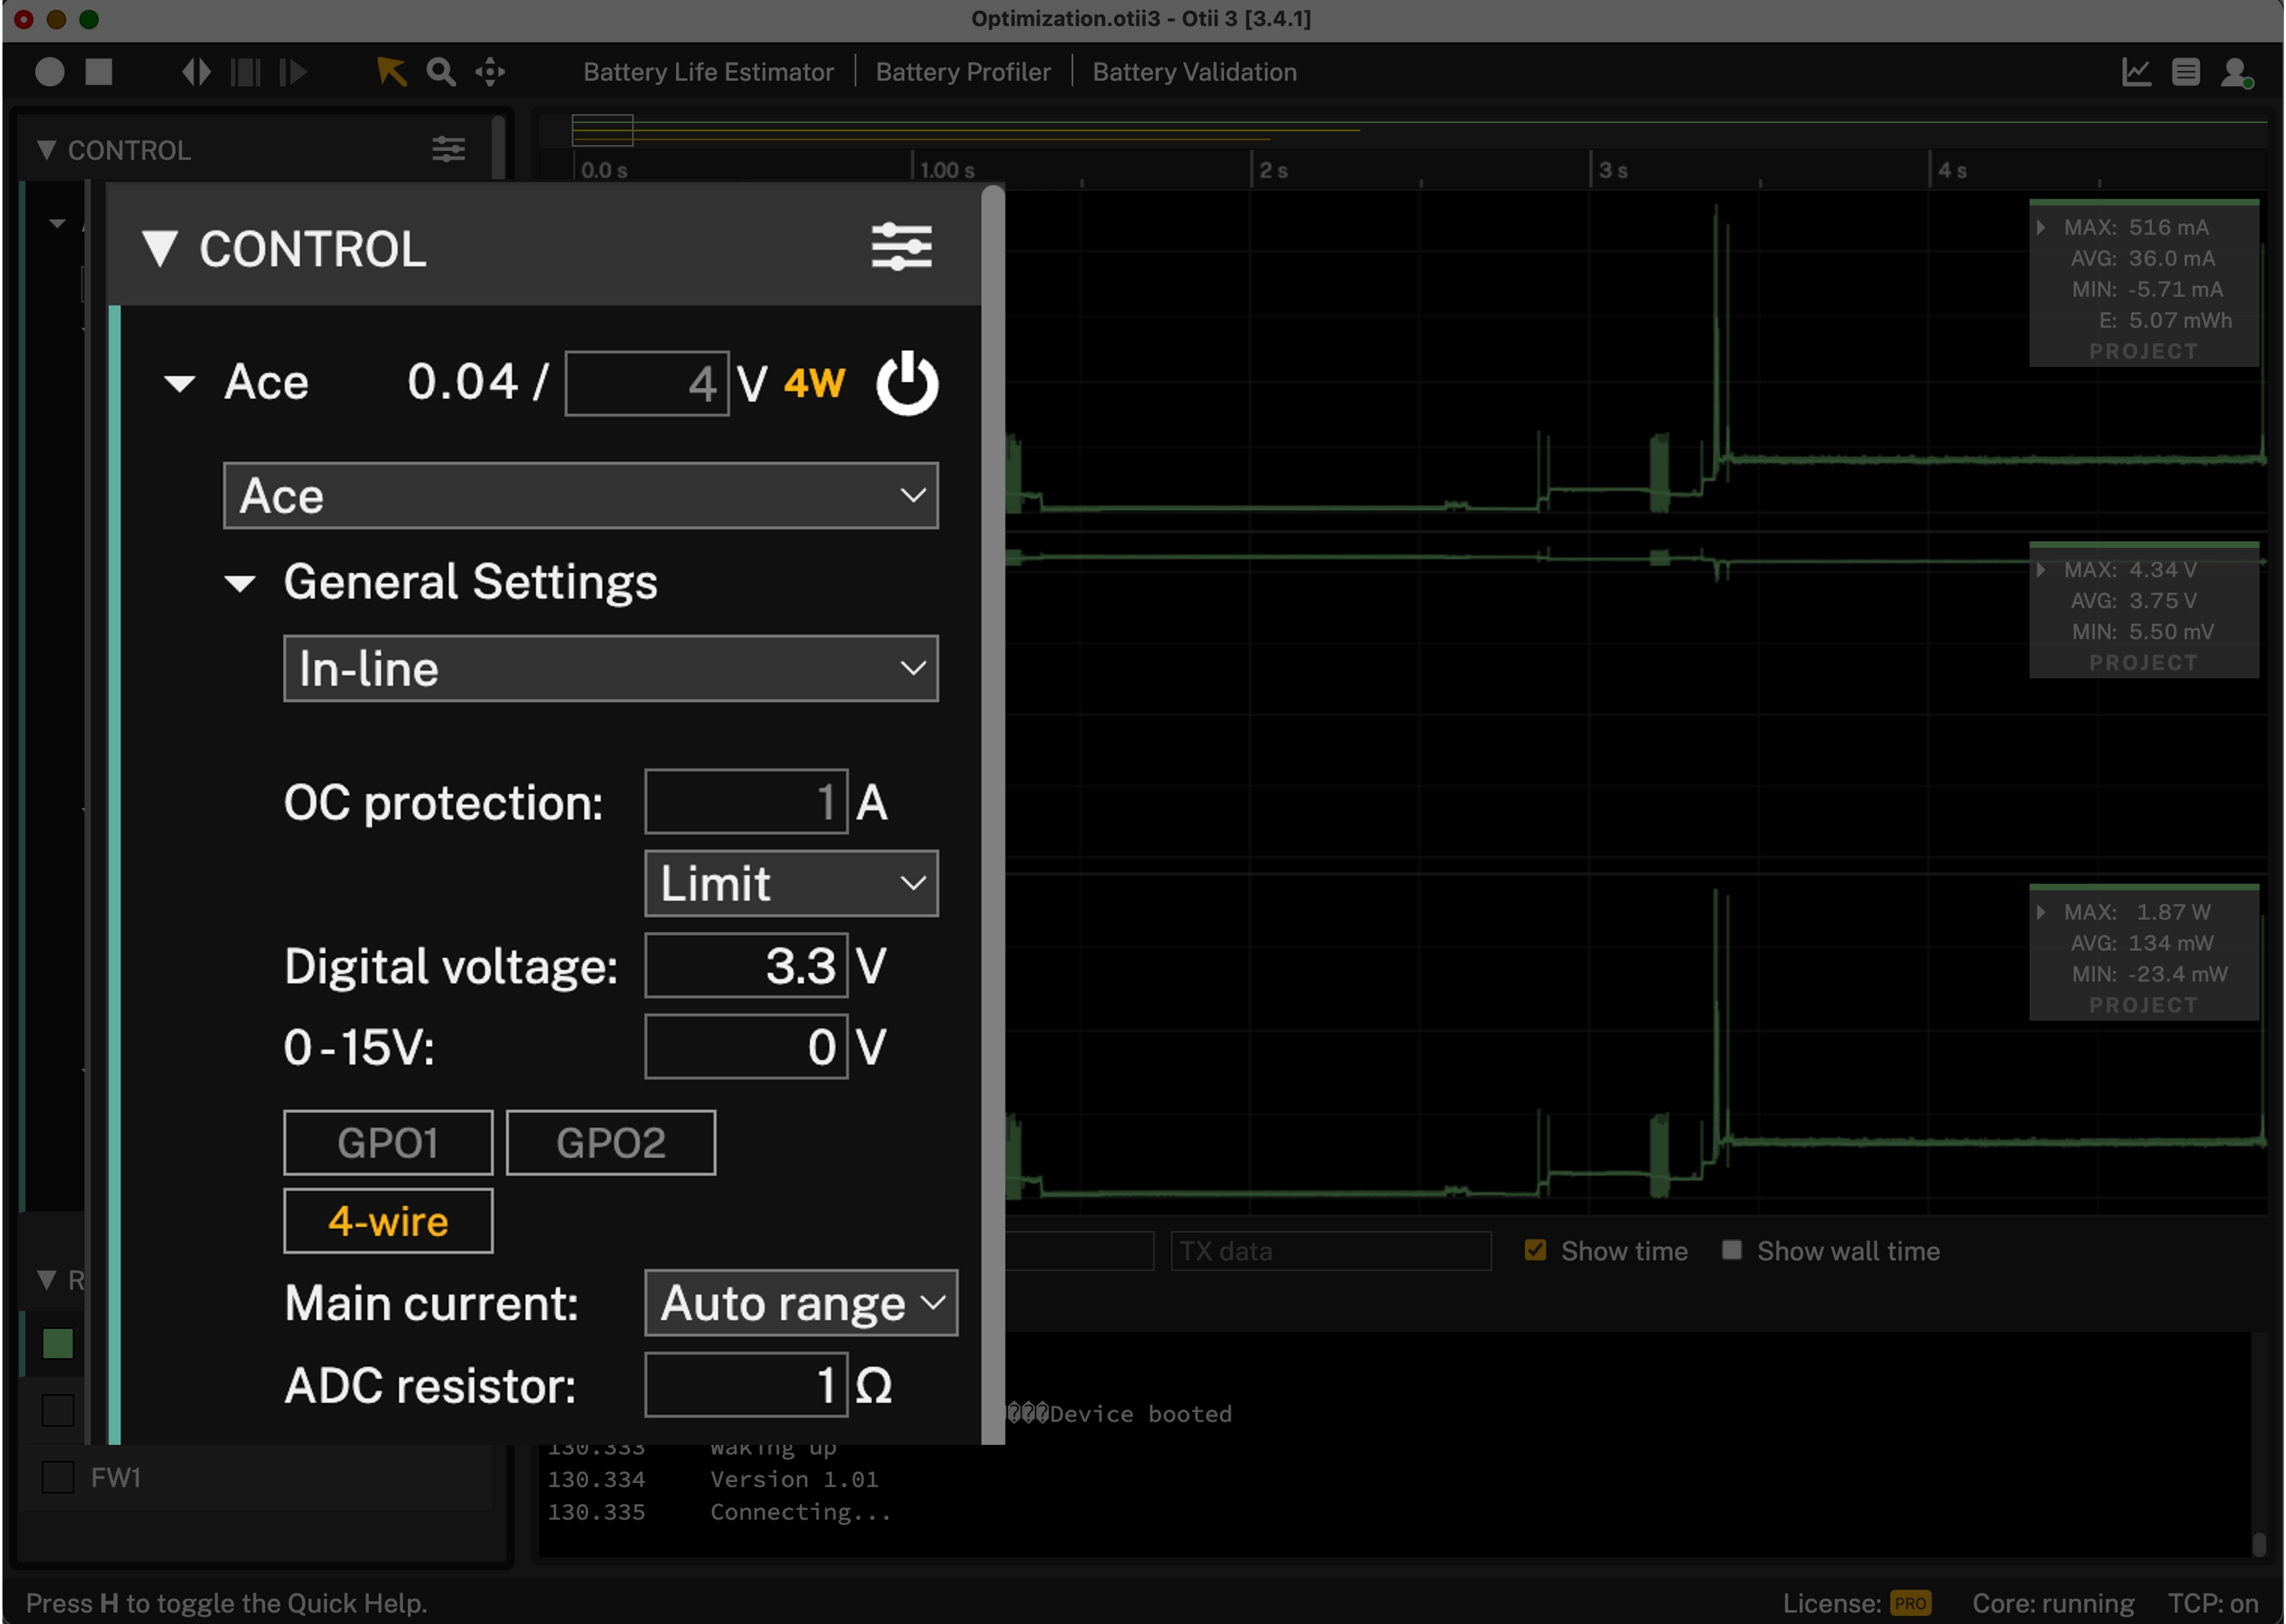
Get started in the Otii application
- Add your Ace under ‘Control’ in the sidebar.
- Change from Power box to In-line mode in ‘General Settings’
- (Optional) Enable 4-wire button. This will highlight 4W next to the voltage control.
- Enable main current, (and if 4-wire enabled) main voltage and main power channel
- Start a recording
- Turn on Ace (Ace will not supply any power)
Analyze measurements
- Analyze the measurements. You can make selections based on how you want to view your recording. To show the whole recording, press the Fit Width button in the toolbar, or shortcut W.
- Auto scale, zoom, drag, or follow graph. There are a few different options for doing this, see in Documentation.
- Analyze min, avg and max values in the statistics section (right corner of the top graph) for the complete recording (Project) or for the viewed recording (View) by making a selection in Settings.
- Analyze statistics for a selected part of the recording by selecting the part of the graph. The values shown are for that selection.
- Compare recordings. You can have several recordings in the same project. Renamed them or change colors to keep track of what was done (right click on the recording name). Sync the recordings for an easier comparison by shifting the current recording in time with Alt + Drag graph.
- Save by going to File and Save Project. The project is saved as .otii3 file and to open it you only need the Otii application, and no Otii Arc/Ace connected.
- Export the project to a zip-archive, that later can be imported. This is handy if you want to collaborate with colleagues and suppliers, you just send your exported .otii3 project file to them.
- Export recordings (all measured data) to csv file by right click on the recording in the side bar and choose Export as csv.
Tips & tricks
 You can have unlimited number of recordings in your project. You can name them and change their colors. You can align the recordings (press H for help), hide and unhide them for comparison.When you click in the graph during the measurements, you will see that the scrolling stops, however the recording continues in the background.In addition to renaming recordings, you can also rename measurements. Right-click on its name in the list of measurements. You can also hide/unhide them.