Otii PRODUCT SUITE
Otii SOFTWARE
OTHER
Analysis
Statistics
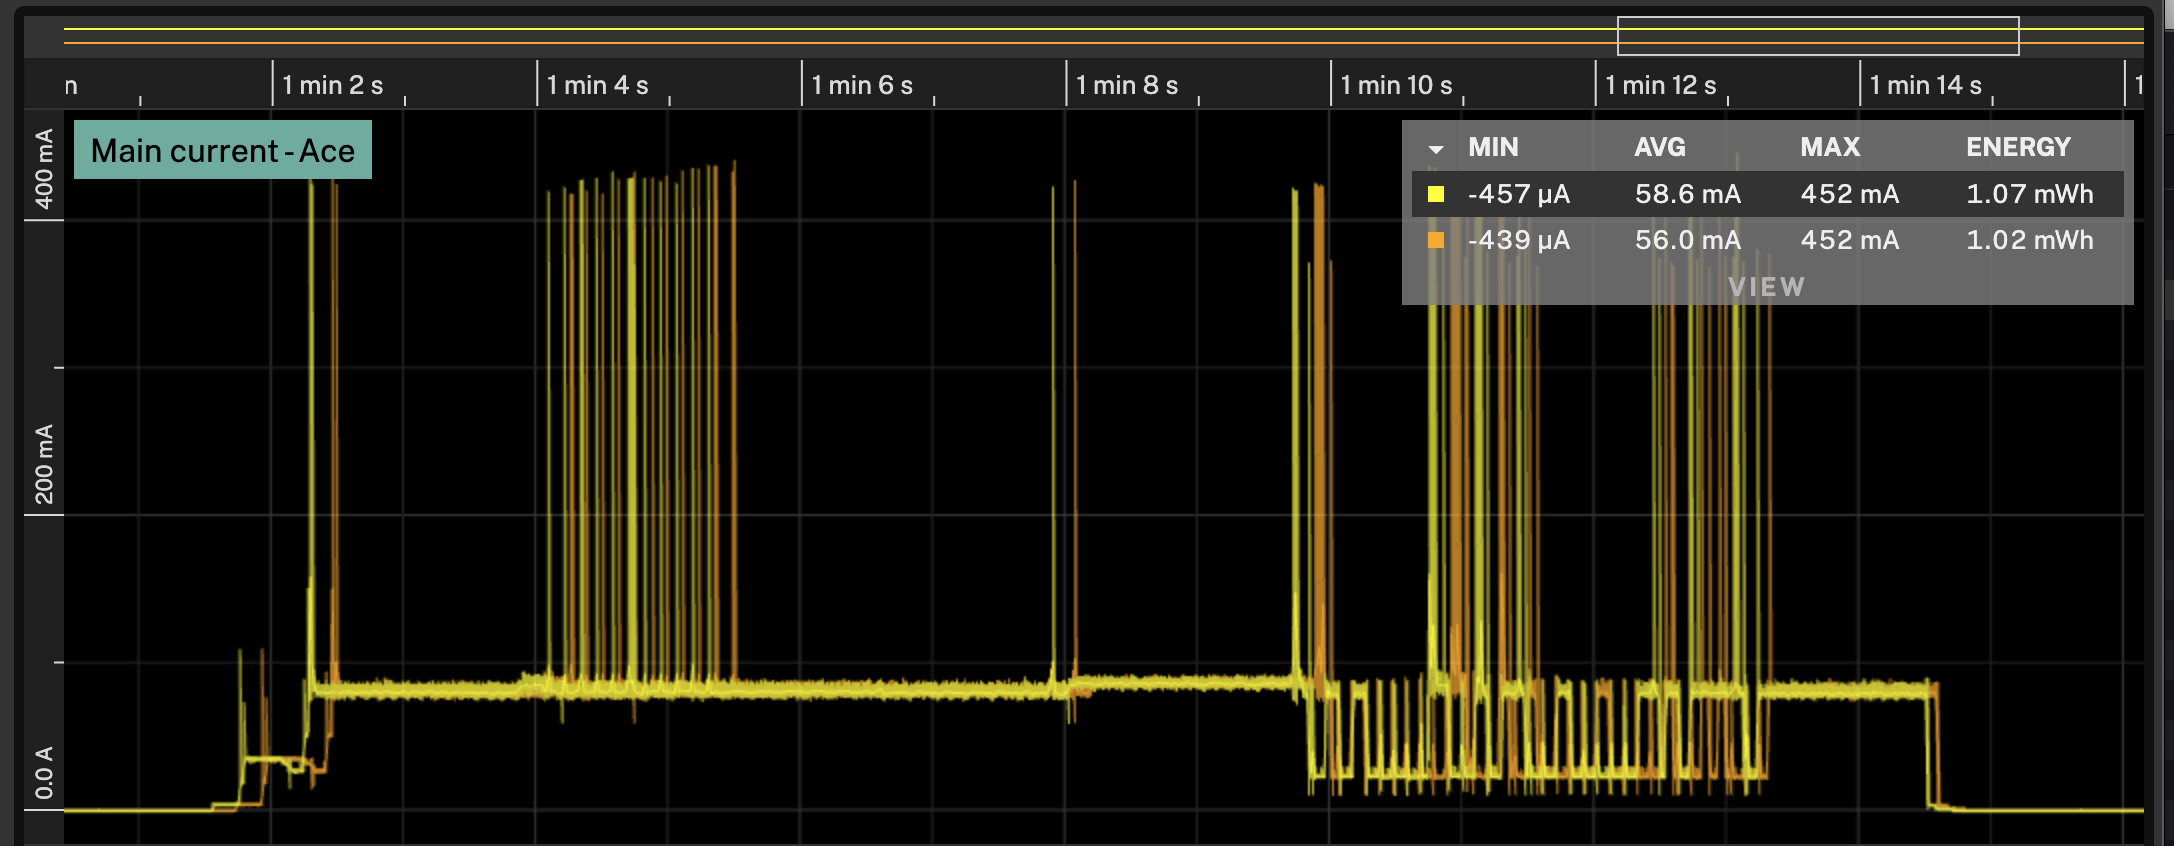
Statistics for the current recording
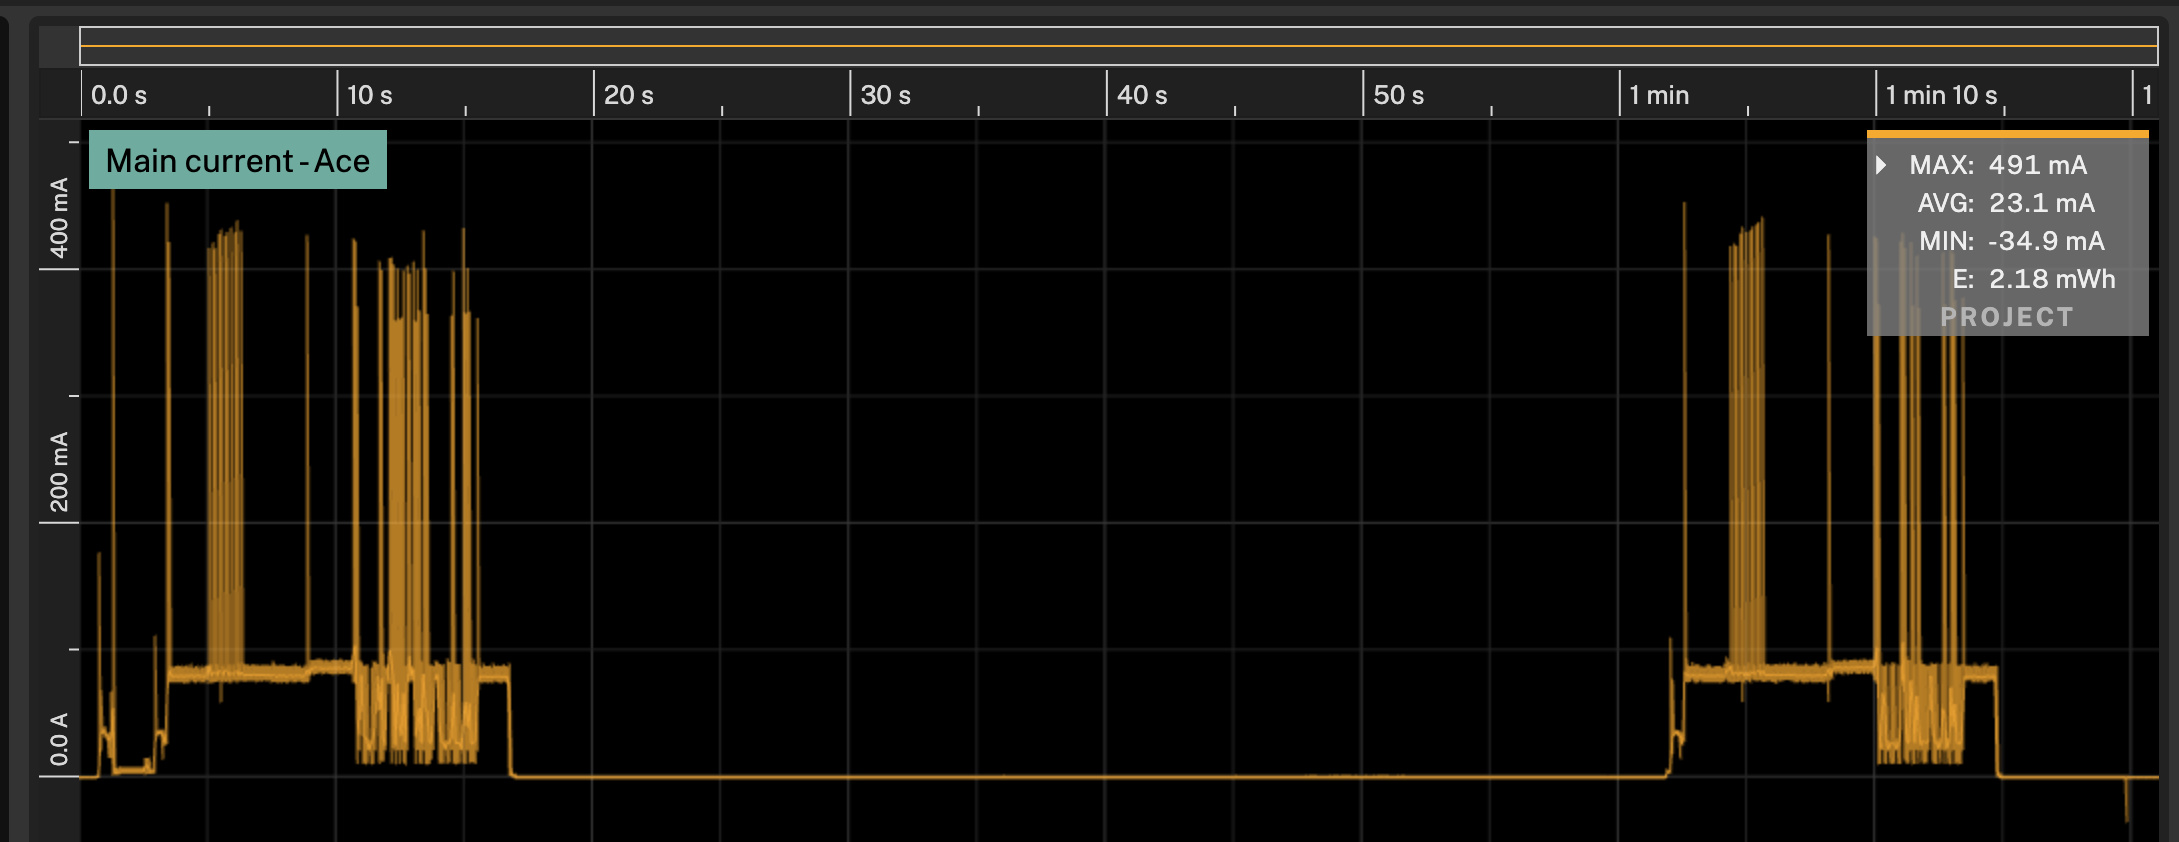
By default, with no selections the statistics view shows the statistics for all data in the project.
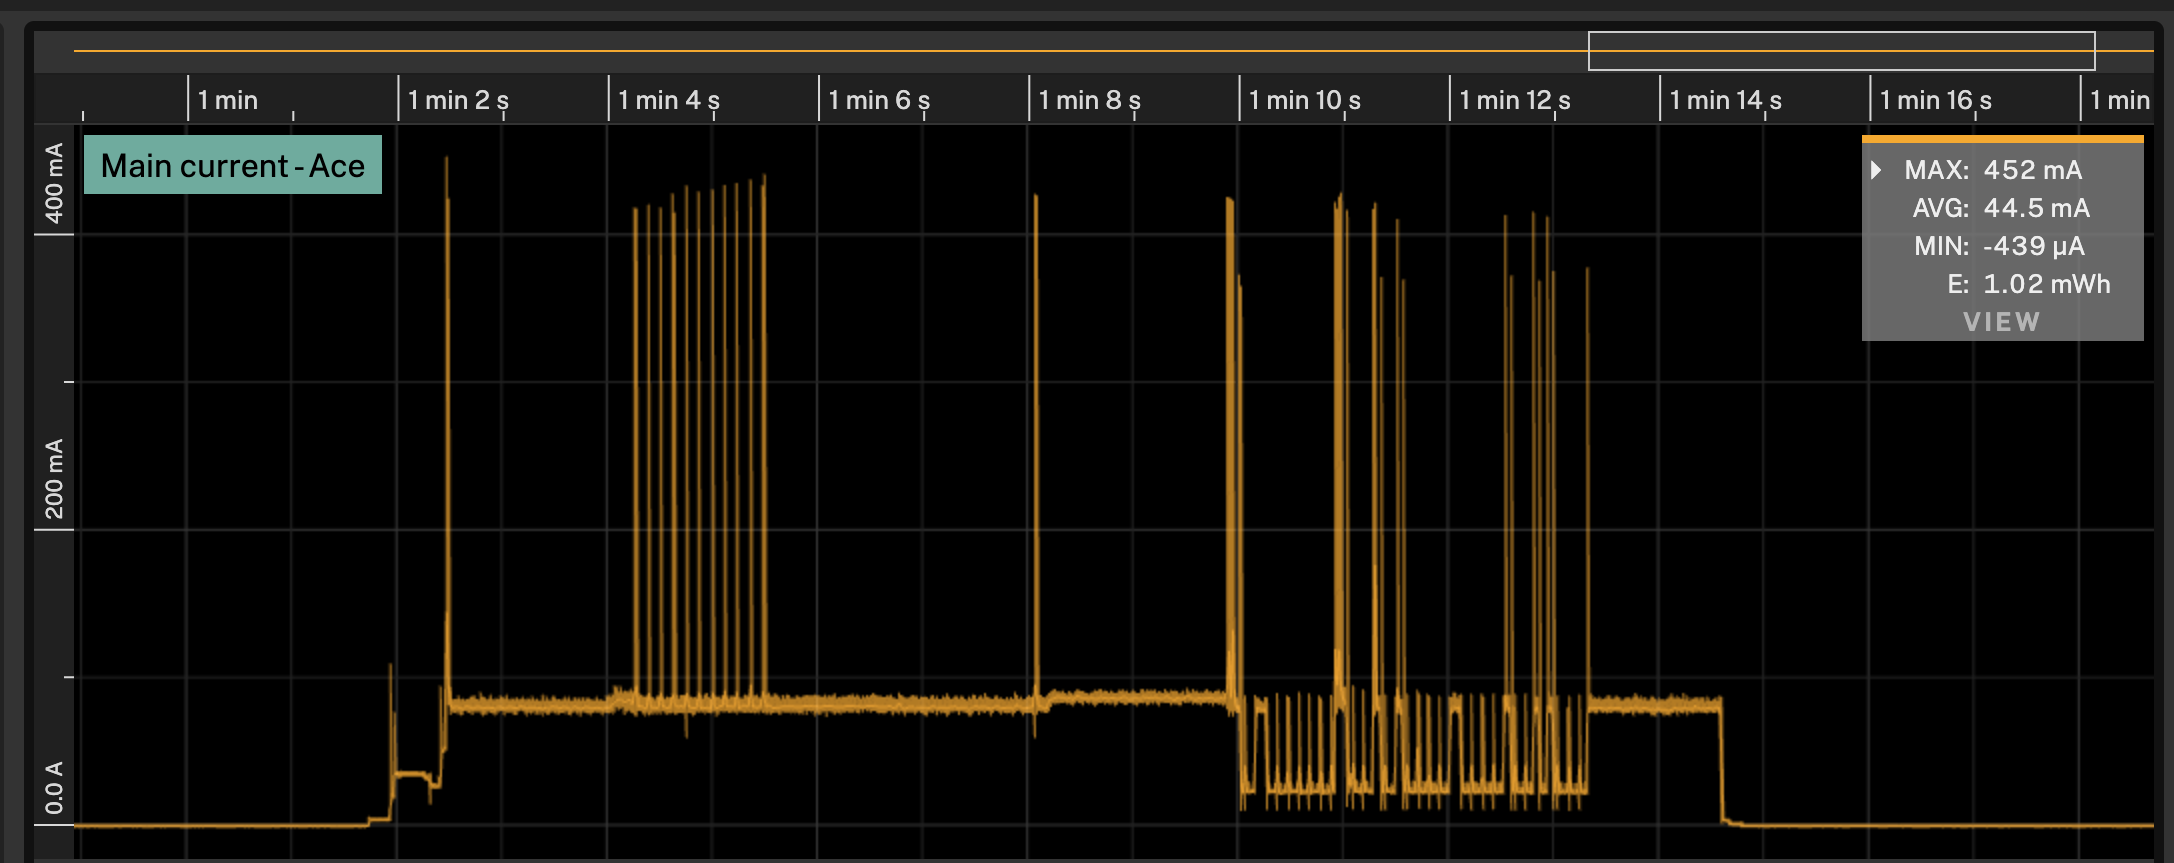
You can change it to be the statistics for the visisble data, by changing the Statistics setting
in the settings to View.
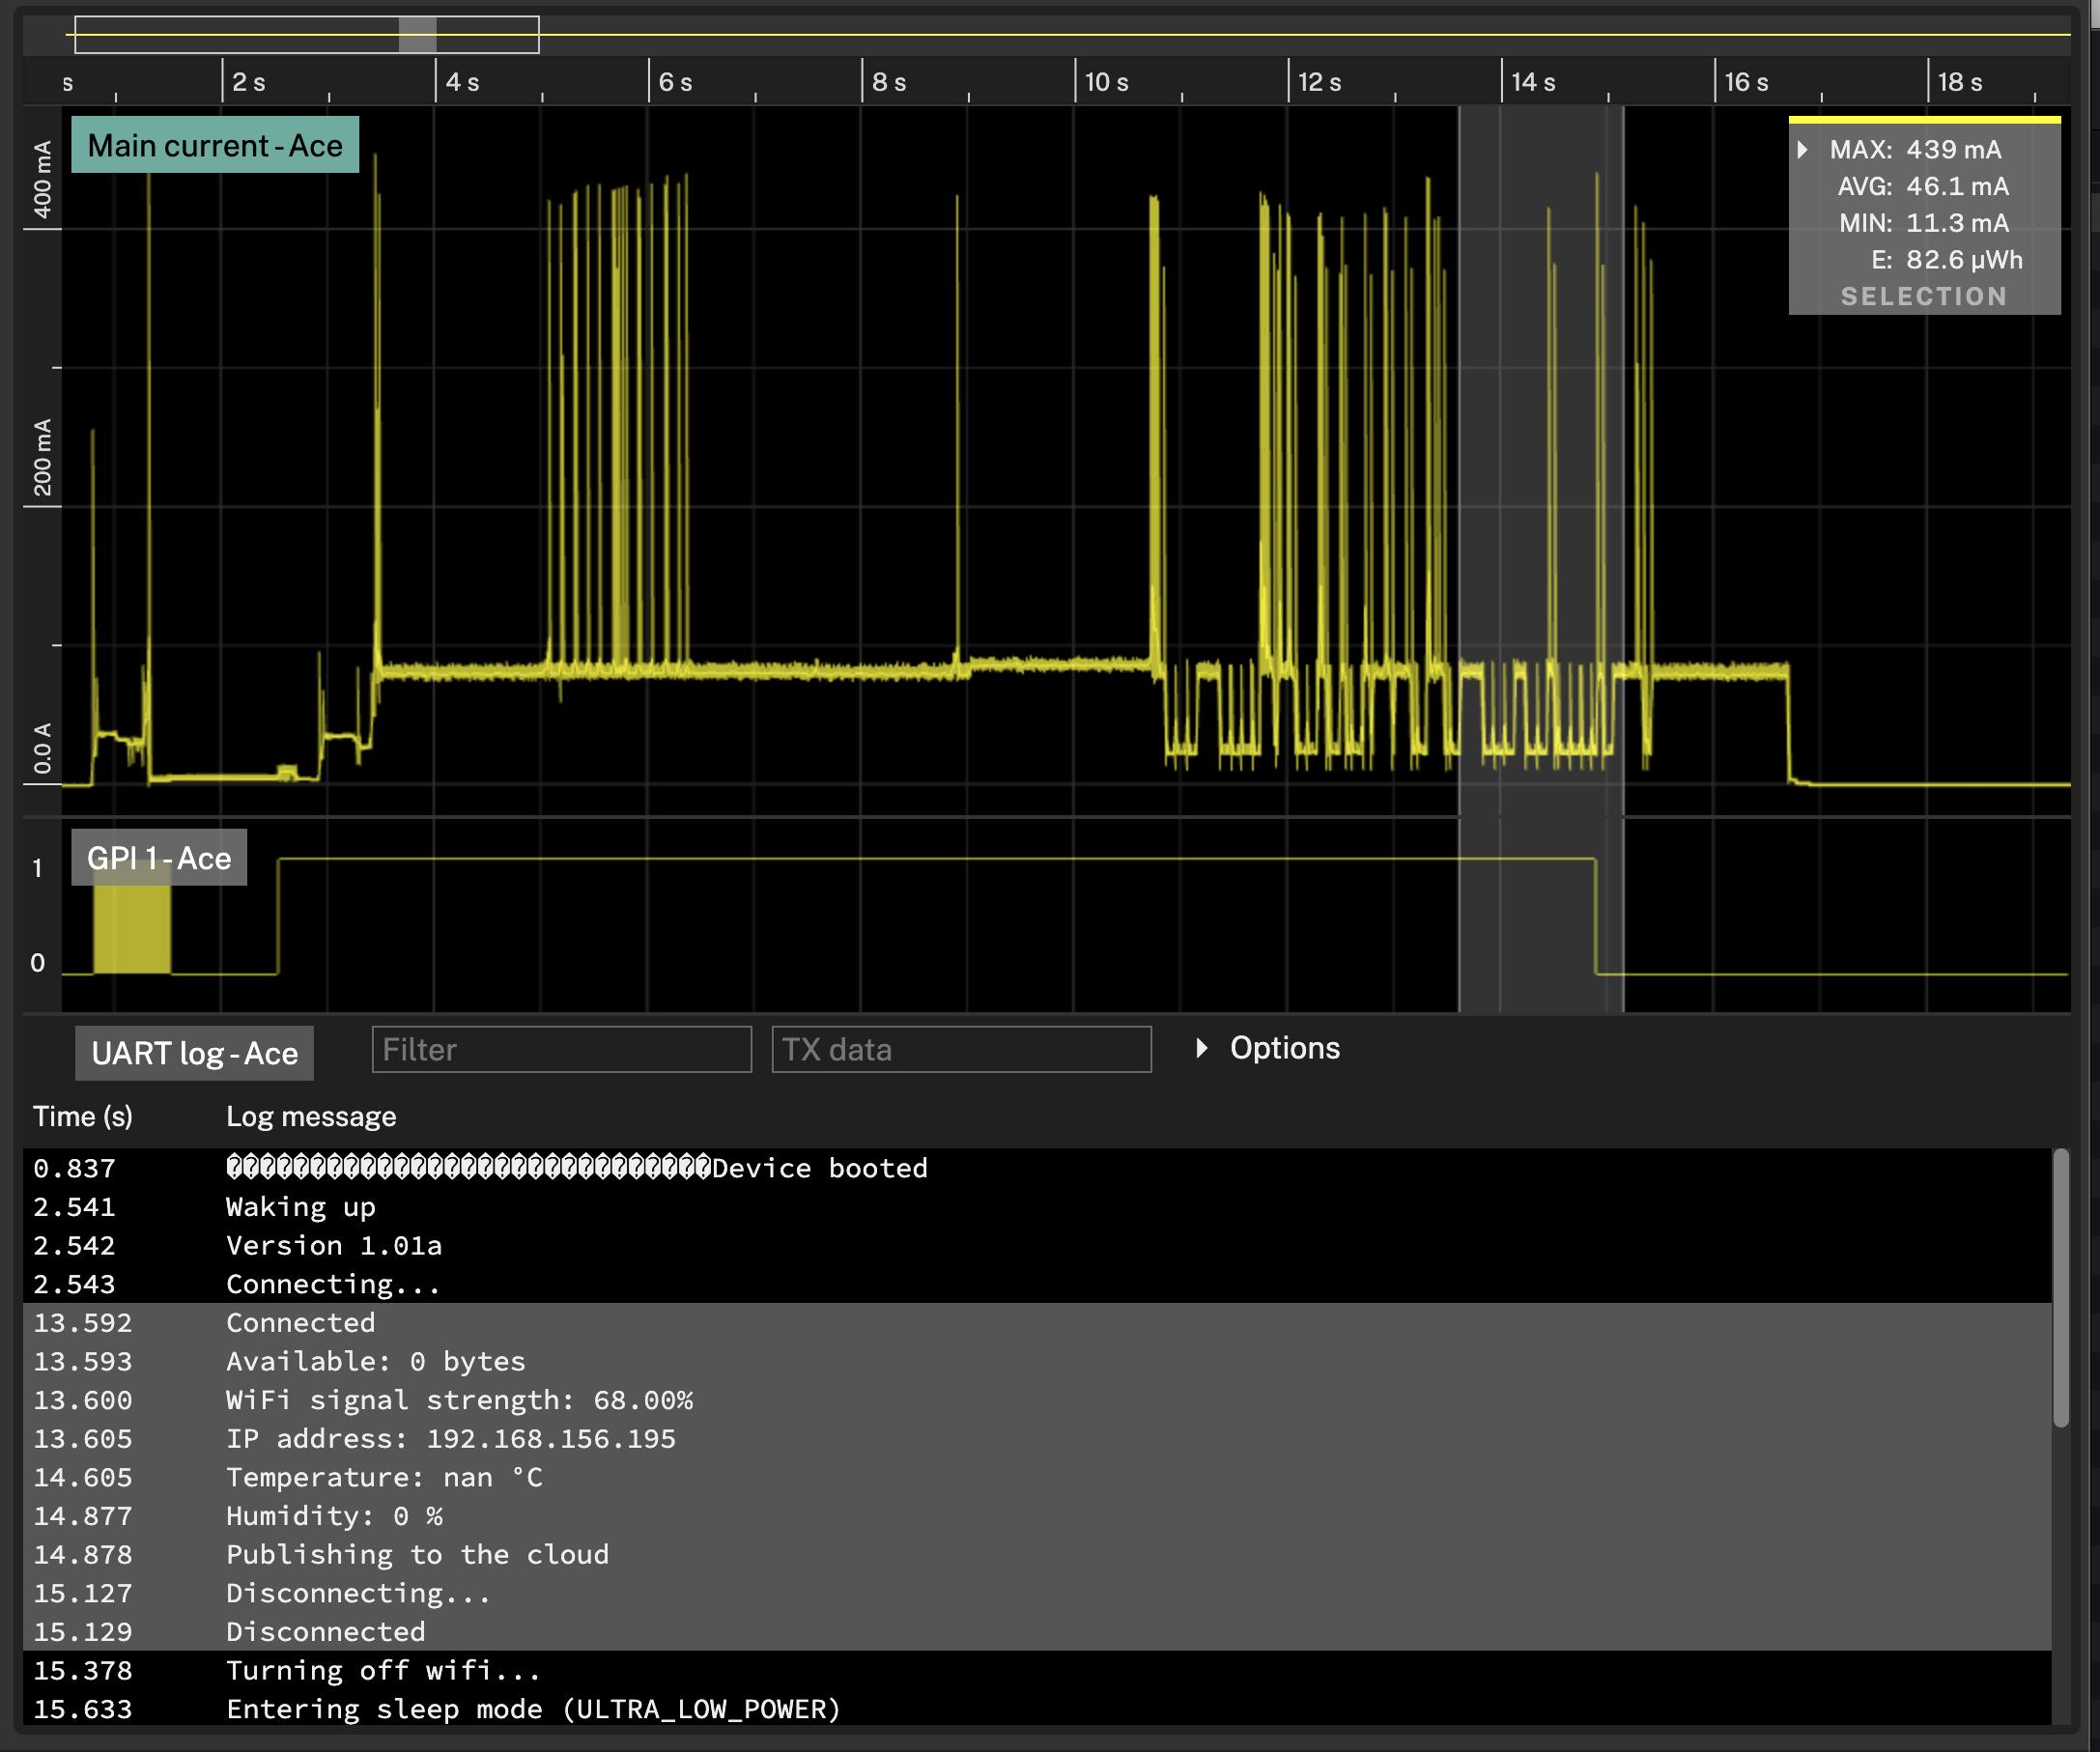
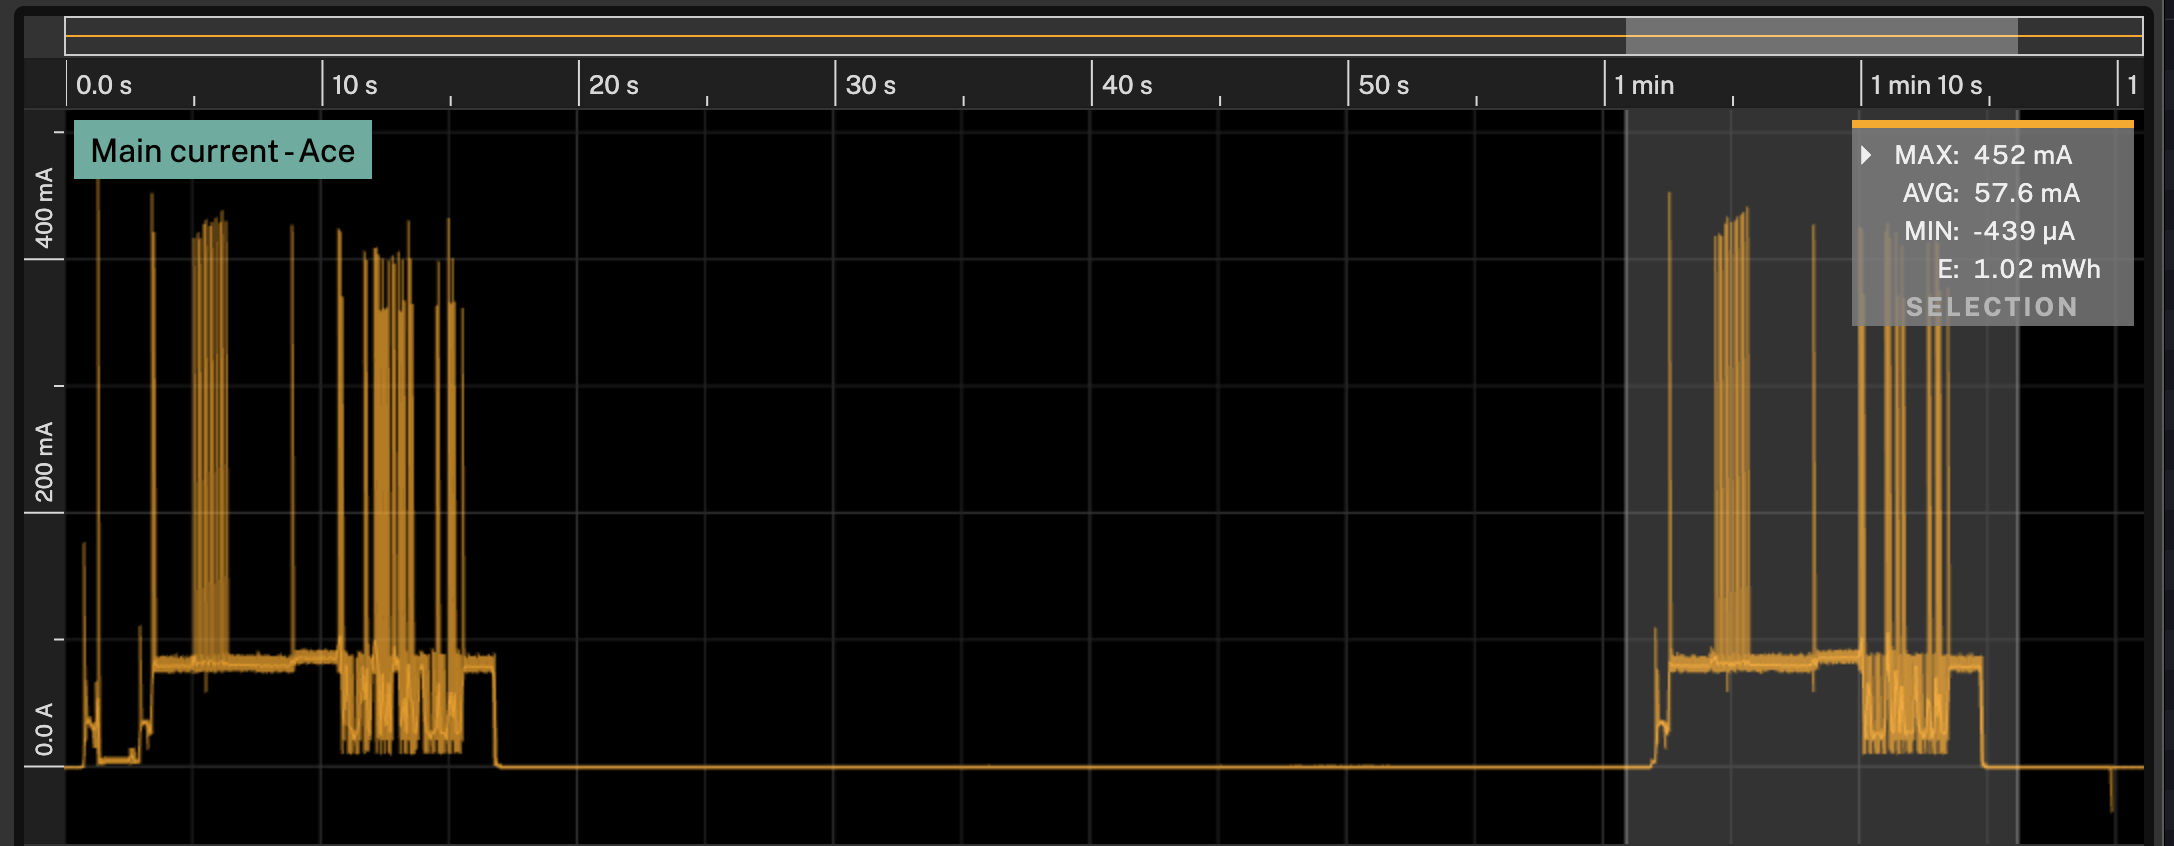
When select a range of data, the statistics view will show the statistics for the selected range.
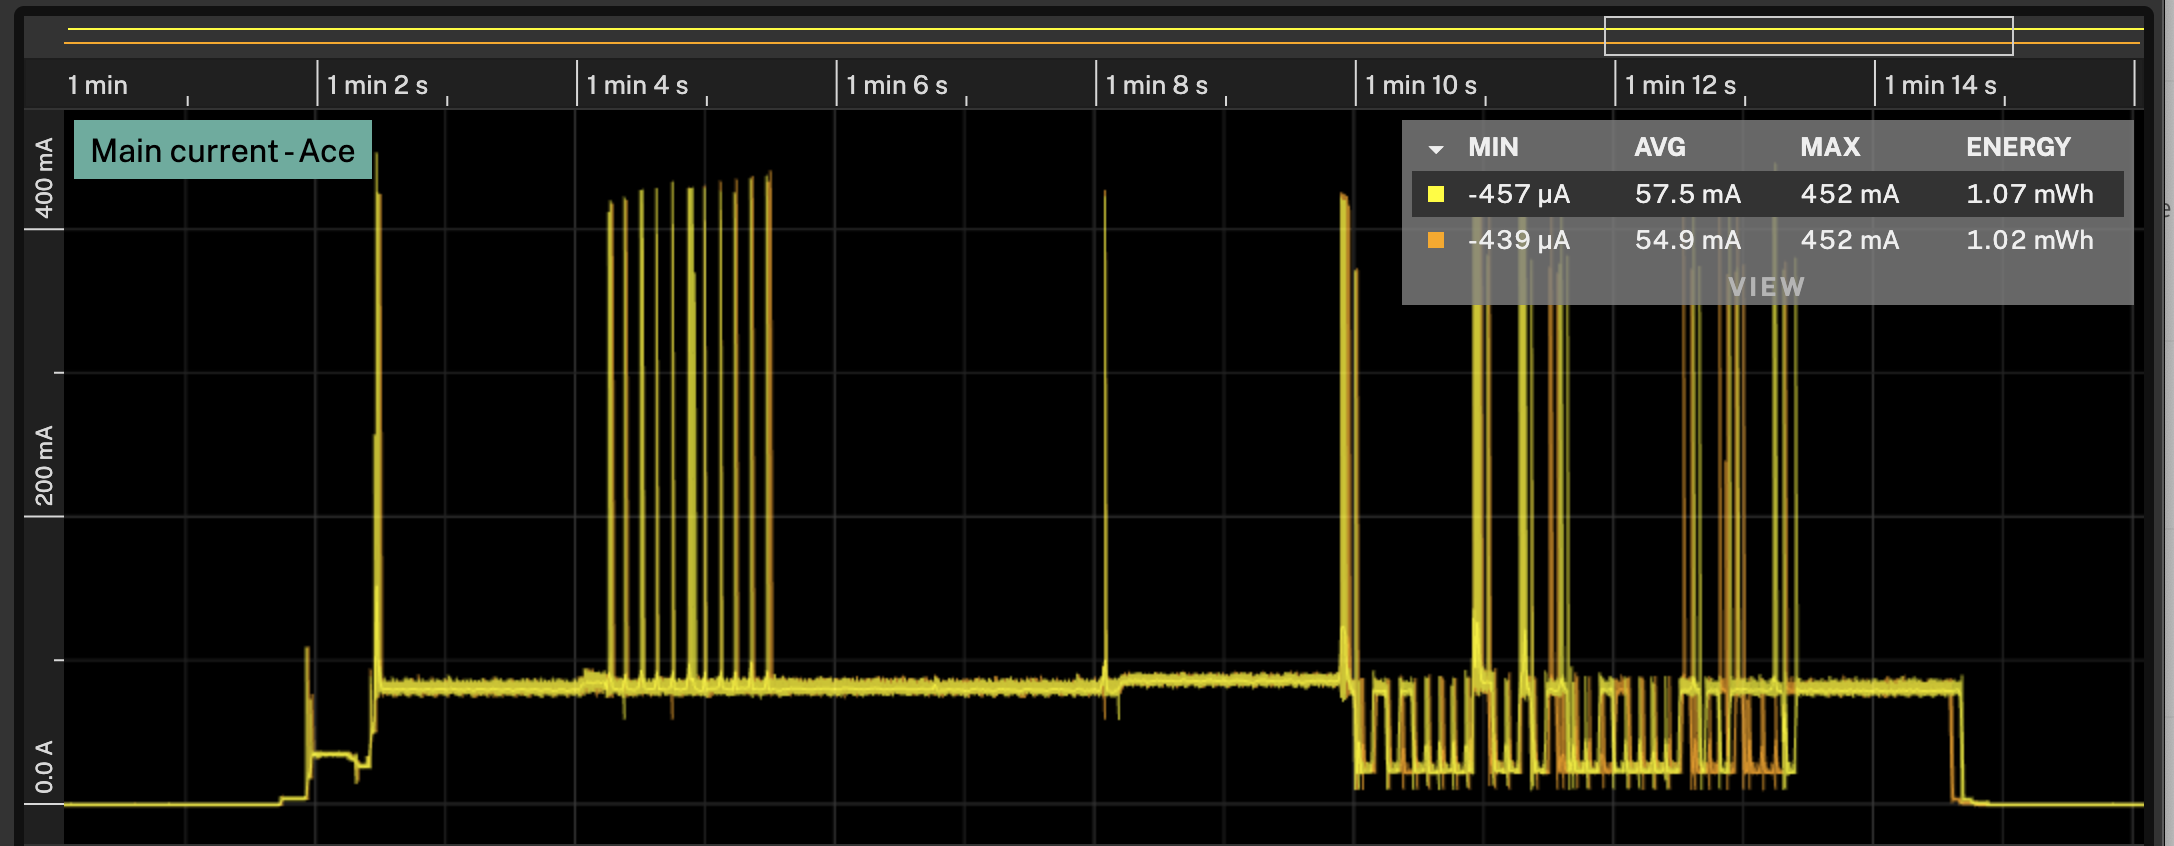
Statistics for multiple recordings
If you have multiple recordings you can compare the statistics for all the visible recordings by clicking the arrow in the top left corner of the statistics view.
Aligning recordings
If you want to compare two recordings you can align them by:
- Select the recording you want to offset
- Select the drag tool in the toolbar
- Hold
⌥while dragging the graph with the mouse - You can also offset the graph with the keyboard with
⌥-Leftor⌥-Right
Sync with log
If you want to analyze a section between two events, you can make a selection in the log, and the corresponding time in the graph will be selected as well.