Recordings
Measurements acquired within the Otii 3 Desktop App are represented as recordings. The measurements can be either single or multiple recordings, and are intended to compare different testing scenarios across the hardware development cycle.
Start recording
Before starting a new recording, make sure to:
- Have an Otii hardware connected and added to the Otii 3 Desktop App.
- Select the channel(s) to be measured.
 If some of the points mentioned above are missing, the notification center notifies the user that these must be done to start the recording.
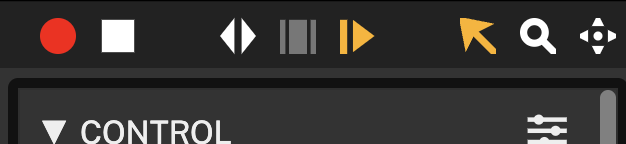
To start recording, click the record button at the top left of the Otii 3 Desktop App. Once clicked, it will change to red, informing the recording is active.
If multiple recordings are required, just one after another, click the record button while it is active, and a new recording will start automatically.
Stop recording
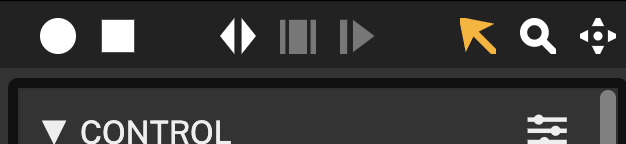
To stop recording, click the stop button located right next to the record button.
It is not required to stop the recording to start a new one. Simply start a new recording by clicking the record button while it is active, as described in the previous step.Recordings context menu
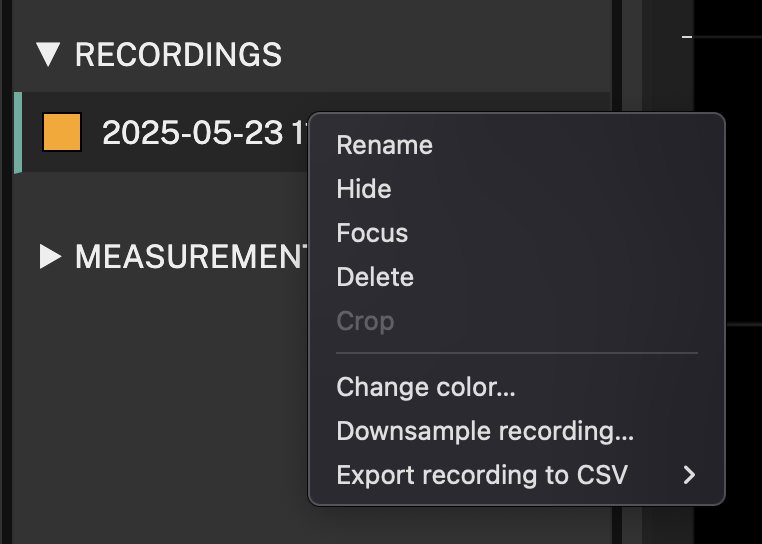
Under the RECORDINGS section, found on the left sidebar of the Otii 3 Desktop App, each of the recordings saved is listed separately. By right-clicking on a recording, a menu is displayed, enabling multiple options to further customize or explore the recording, among them:
Rename recording
Right-click on the recording, select the Rename option, and assign the new name. Alternatively, double-click on the recording's name to rename it.
Hide/Show recording
Right-click on the recording and select the Hide option. Once hidden, the recording is still shown in the saved recordings but will be hidden from the graphs. To display the graph recording again, right-click on the recording and select the Show option.
Alternatively, click on the colored box beside the recording name. Once clicked, the box becomes uncolored, indicating that the graph is hidden. By clicking again, it will be recolored, indicating that the graph is being shown.
Focus/Unfocus recording
This option allows the focus of the graph visualization on a single recording, while the other recordings are grayed out in the background instead of the color assigned to the recordings.
To focus on a specific recording, right-click on the recording and select the Focus option. To unfocus it, follow the same instructions but this time, click on the Unfocus option.
Once the focus option has been enabled on a recording, it can be switched between the different recordings by simply clicking on the desired recording to be focused on.
Delete recording
Right-click on the recording desired to be deleted and select the Delete option.
Alternatively, click on the recording desired to be deleted and press the delete key.
Crop recording
By default, the crop option is disabled, as a graph segment must be selected to enable cropping.
On the graph visualization section, select the graph segment to keep by clicking on the starting point, and holding the click until the desired end point for the graph to be cropped. After selecting the graph segment, right-click on the recording desired and select the Crop option.
Change color
To change the default color assigned to the recording graph, right-click on the recording and select the Change color... option. Once selected, a window with multiple colors to choose open. Choose the desired color, which will automatically apply to the graph. Click the Close button to close the window.
Downsample recording
In case of requiring a lower sample rate when analyzing the recordings, it can be modified it by right-clicking on the desired recording and selecting the Downsample recording... option. Once selected, a window will open listing all the channels enabled for recording, where one or several at a time can be selected. Define the new sample rate, and to set it, just click the Downsample button.
 Downsampling removes data points from the measurement and replaces them with average values, so unless you undo the downsample, you cannot increase the sample rate after it.
The sampling rate resolution while recording differs according to the version of Otii hardware in use. For Otii Arc Pro, the sample rate is up to 4 ksps and is not adjustable. For Otii Ace Pro, it is adjustable up to 50 ksps Note that the sample rate differs depending on the channel,
The sample rate differs depending on the channel. Check the following docs for further info:
Export to CSV
To export recordings as CSV, right-click on the desired recording and click the Export to CSV... option. Assign the desired name for the recording, and click Save.
Recording tools
Graph tools
The graph tools within the Otii Product Suite are designed to facilitate the analysis and optimization of multiple channels, such as voltage, current, and power.
Selection tool
With the selection tool selected, the mouse can be used to select a specific time span. The statistics will be updated to show the statistics for the selected area. You can drag the edges to change the selection size and drag the entire selection along the time axis by pressing the command simultaneously.
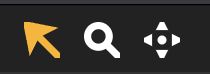
To activate the Selection tool, press the icon or press S on the keyboard to draw
the selection in the graphs.
Zoom tool
With the zoom tool enabled, you can draw an area in a specific to zoom into.
To activate the Zoom tool, press the icon or press Z on the keyboard and use the mouse
to click and draw a zoom area. The mouse wheel + Ctrl / ⌘ can also be used to
zoom in and out at any time. By default, the mouse wheel zooms on the X-axis.
Hold Alt to zoom the Y axis instead.
Drag tool
With the drag tool, you can drag a specific graph in any direction.
If you press Alt / ⌥ when the drag tool is enabled, only the currently active graph
on the X-axis will be moved. This will offset the graph with respect to the other,
which is very useful when comparing different recordings.
To activate the Drag tool, click on the icon located on the toolbar.
Plot tools
The plot tools enable the customization of the behavior of visualizations for further analisys. The tools available can be active, enabled, and disabled.
- Fit width: with this enabled, all the graphs will be zoomed out to show all the content
- Zoom to selection: if there is a selection, this makes the selection fill the entire view
- Follow: with this enabled, the tail of the current recording will be kept in the view
Recording viewers
Depending on the data type, the data is visualized in three different kind of viewers - analog, digital & log.
Analog
The analog viewer shows analog data recorded from the current, voltage and power channels. There is one analog view for each analog measurement, showing all the available recordings for each measurement in different colors.
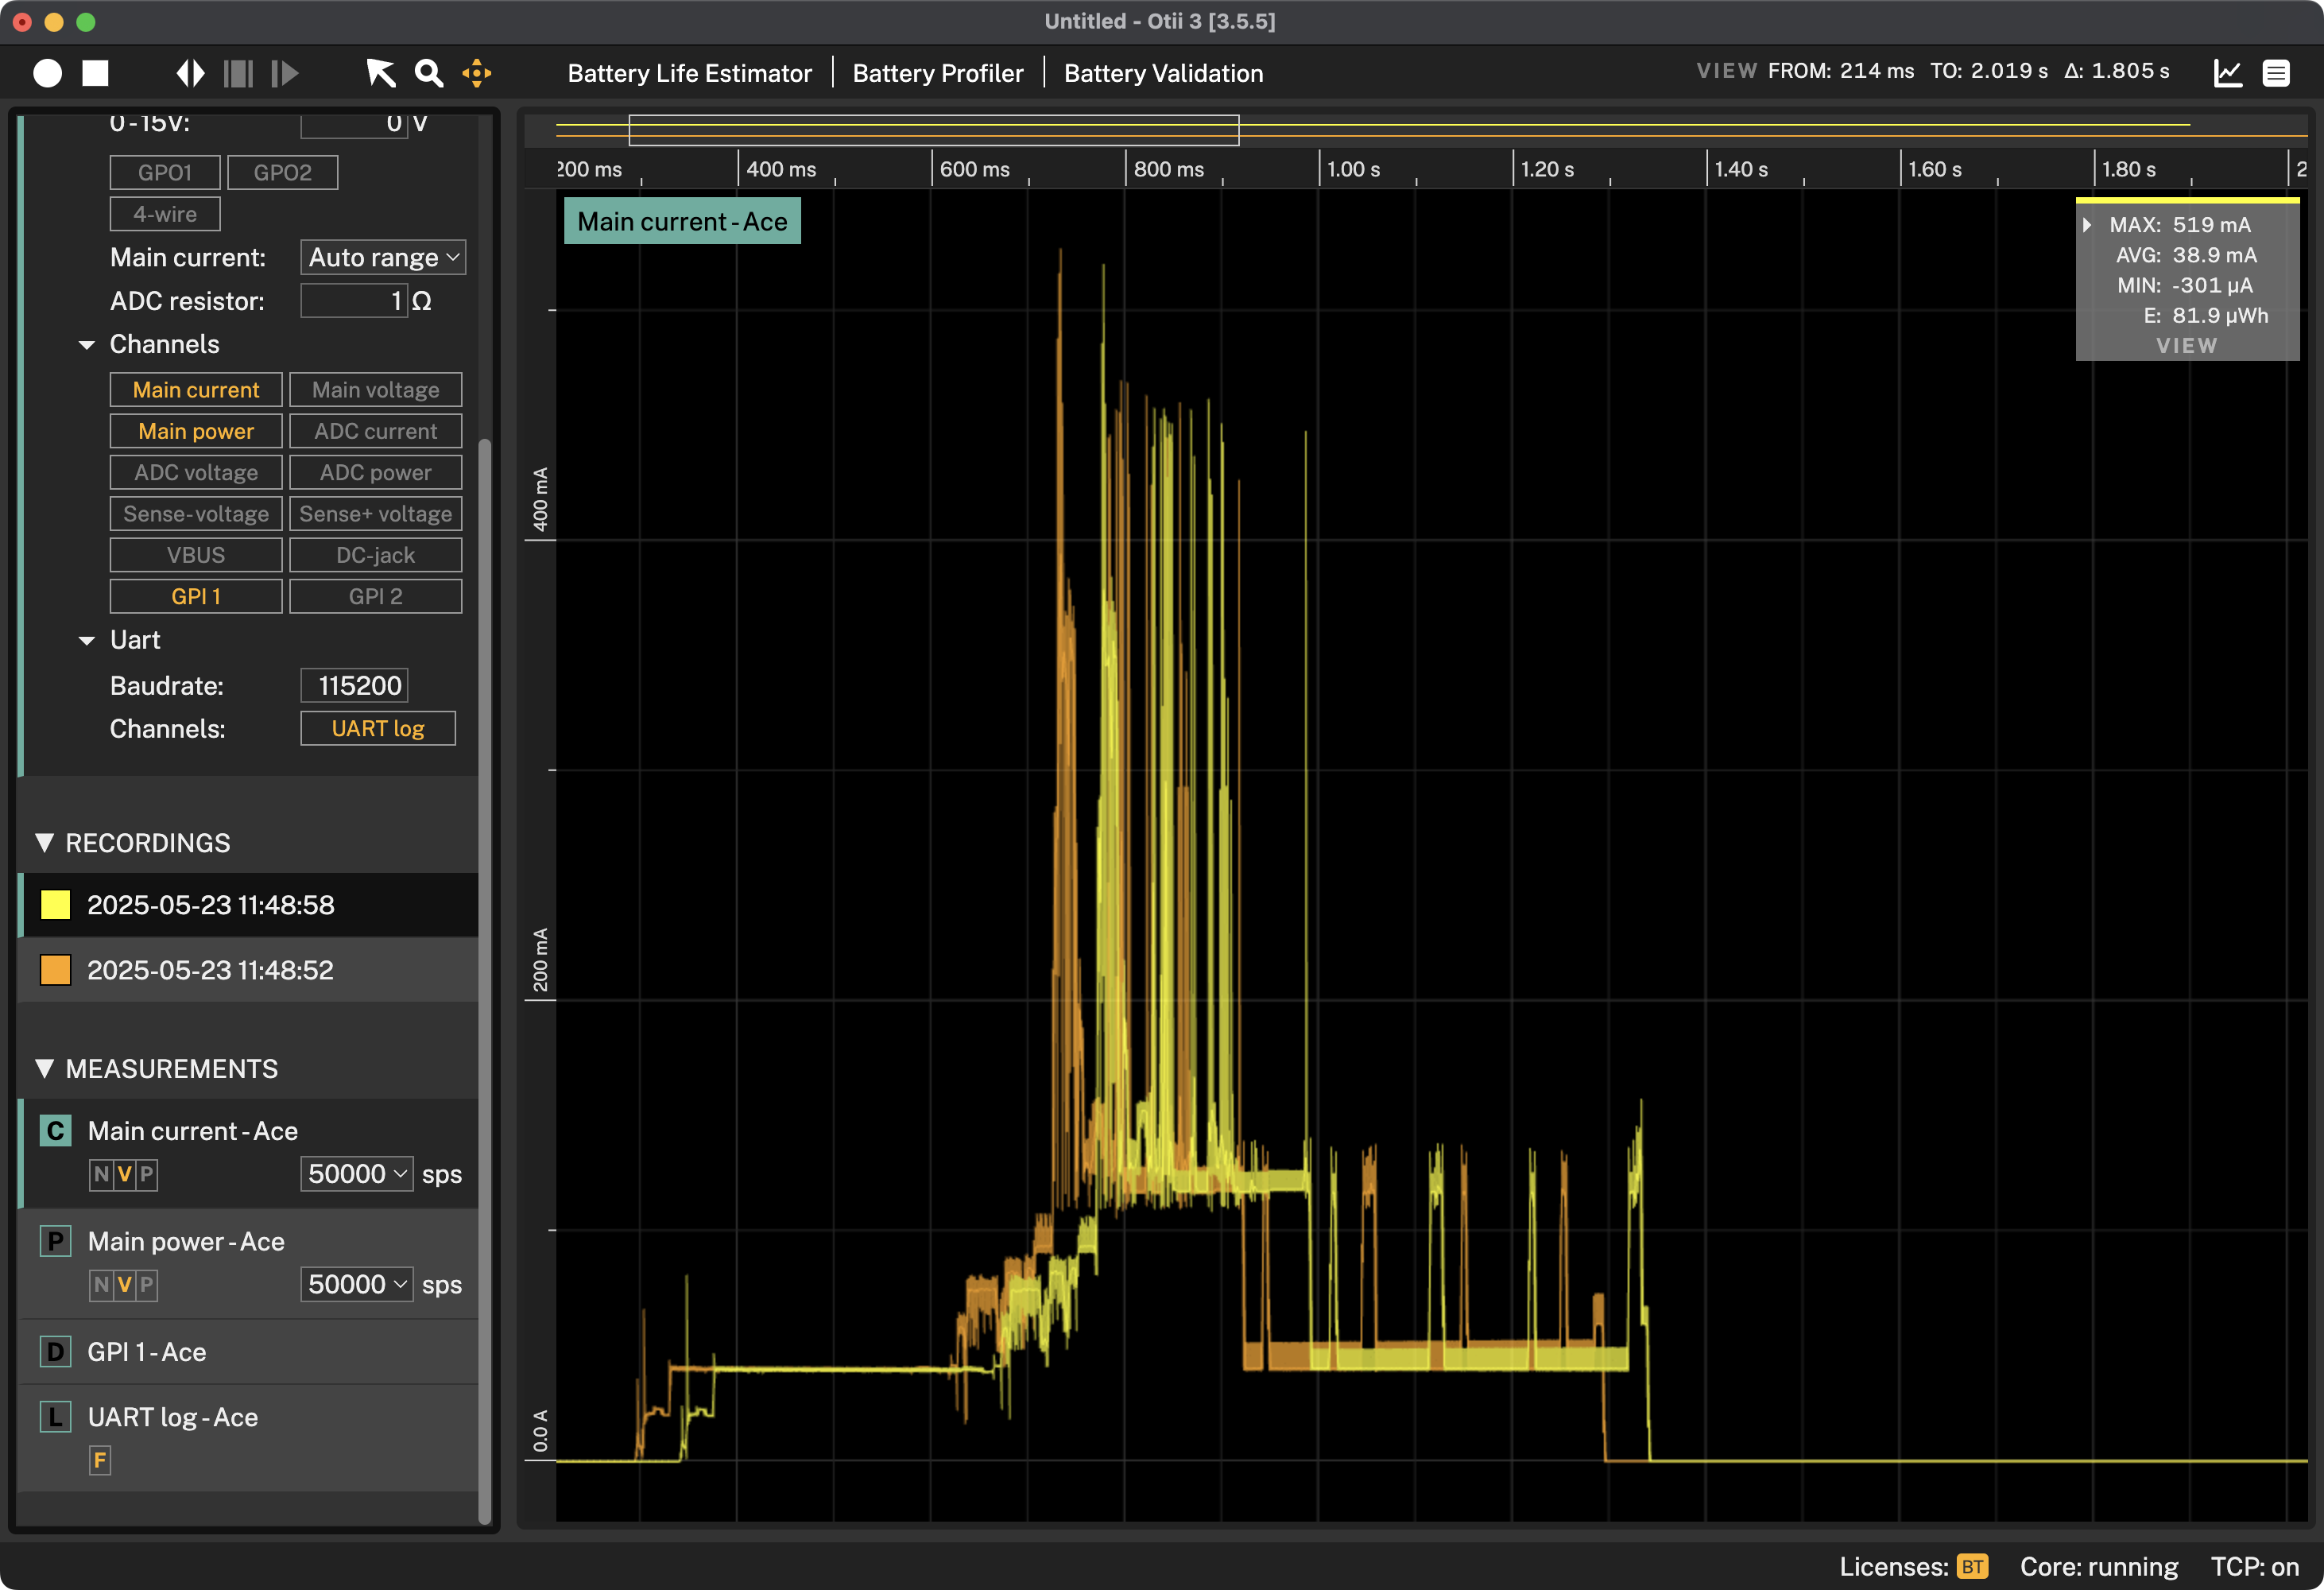
Scroll bar
At the top of the all viewers there is a scroll bar that show an overview of all the recordings in the project, and a white rectangle that represents the current view of the data.
You can scroll horizontally by dragging the white rectangle, and you can zoom horizontally by dragging the left and right border of the rectangle.
Graph
Below the scroll bar is the graph showing part of the actual recordings. You can in addition to the scroll bar use the graph tools to navigate in the graph and to select data to analyse.
Context menu
The context menu is displayed by right-clicking anywhere in the graph. The following options will be avaible the the analog view:
- Select all: select all data
- Clear selection: clear the current selection
- Zoom to selection: when having a selection and right-click and select Zoom to selection, then the selection will fill the whole graph. This is the quickest way to zoom to the part that's desired to be analyzed
- Set value range: the time range to be evaluated can be adjusted from and to a specific time. This time will be the same for all the graphs shown
- Set time range: according to the channel graph selected, the time range to be evaluated can be adjusted from and to a specific time
- Crop active recordings: the selected recording will be cropped, keeping the selection,
and all other recordings will remain unchanged.
If the undo history hasn't cleared up, the crop can be undone by pressing
Ctrl-Z/⌘-Z - Crop all recordings: this will crop all the recordings, even the recordings
that are not selected, keeping the data within the selection. If the undo history
hasn't cleared up, the crop can be undone by pressing
Ctrl-Z/⌘-Z.
Digital
The digital viewer shows digital data recorded from the GPI pins. There is one digital view for each digital measurement, showing all the available recordings for each measurement in different colors.
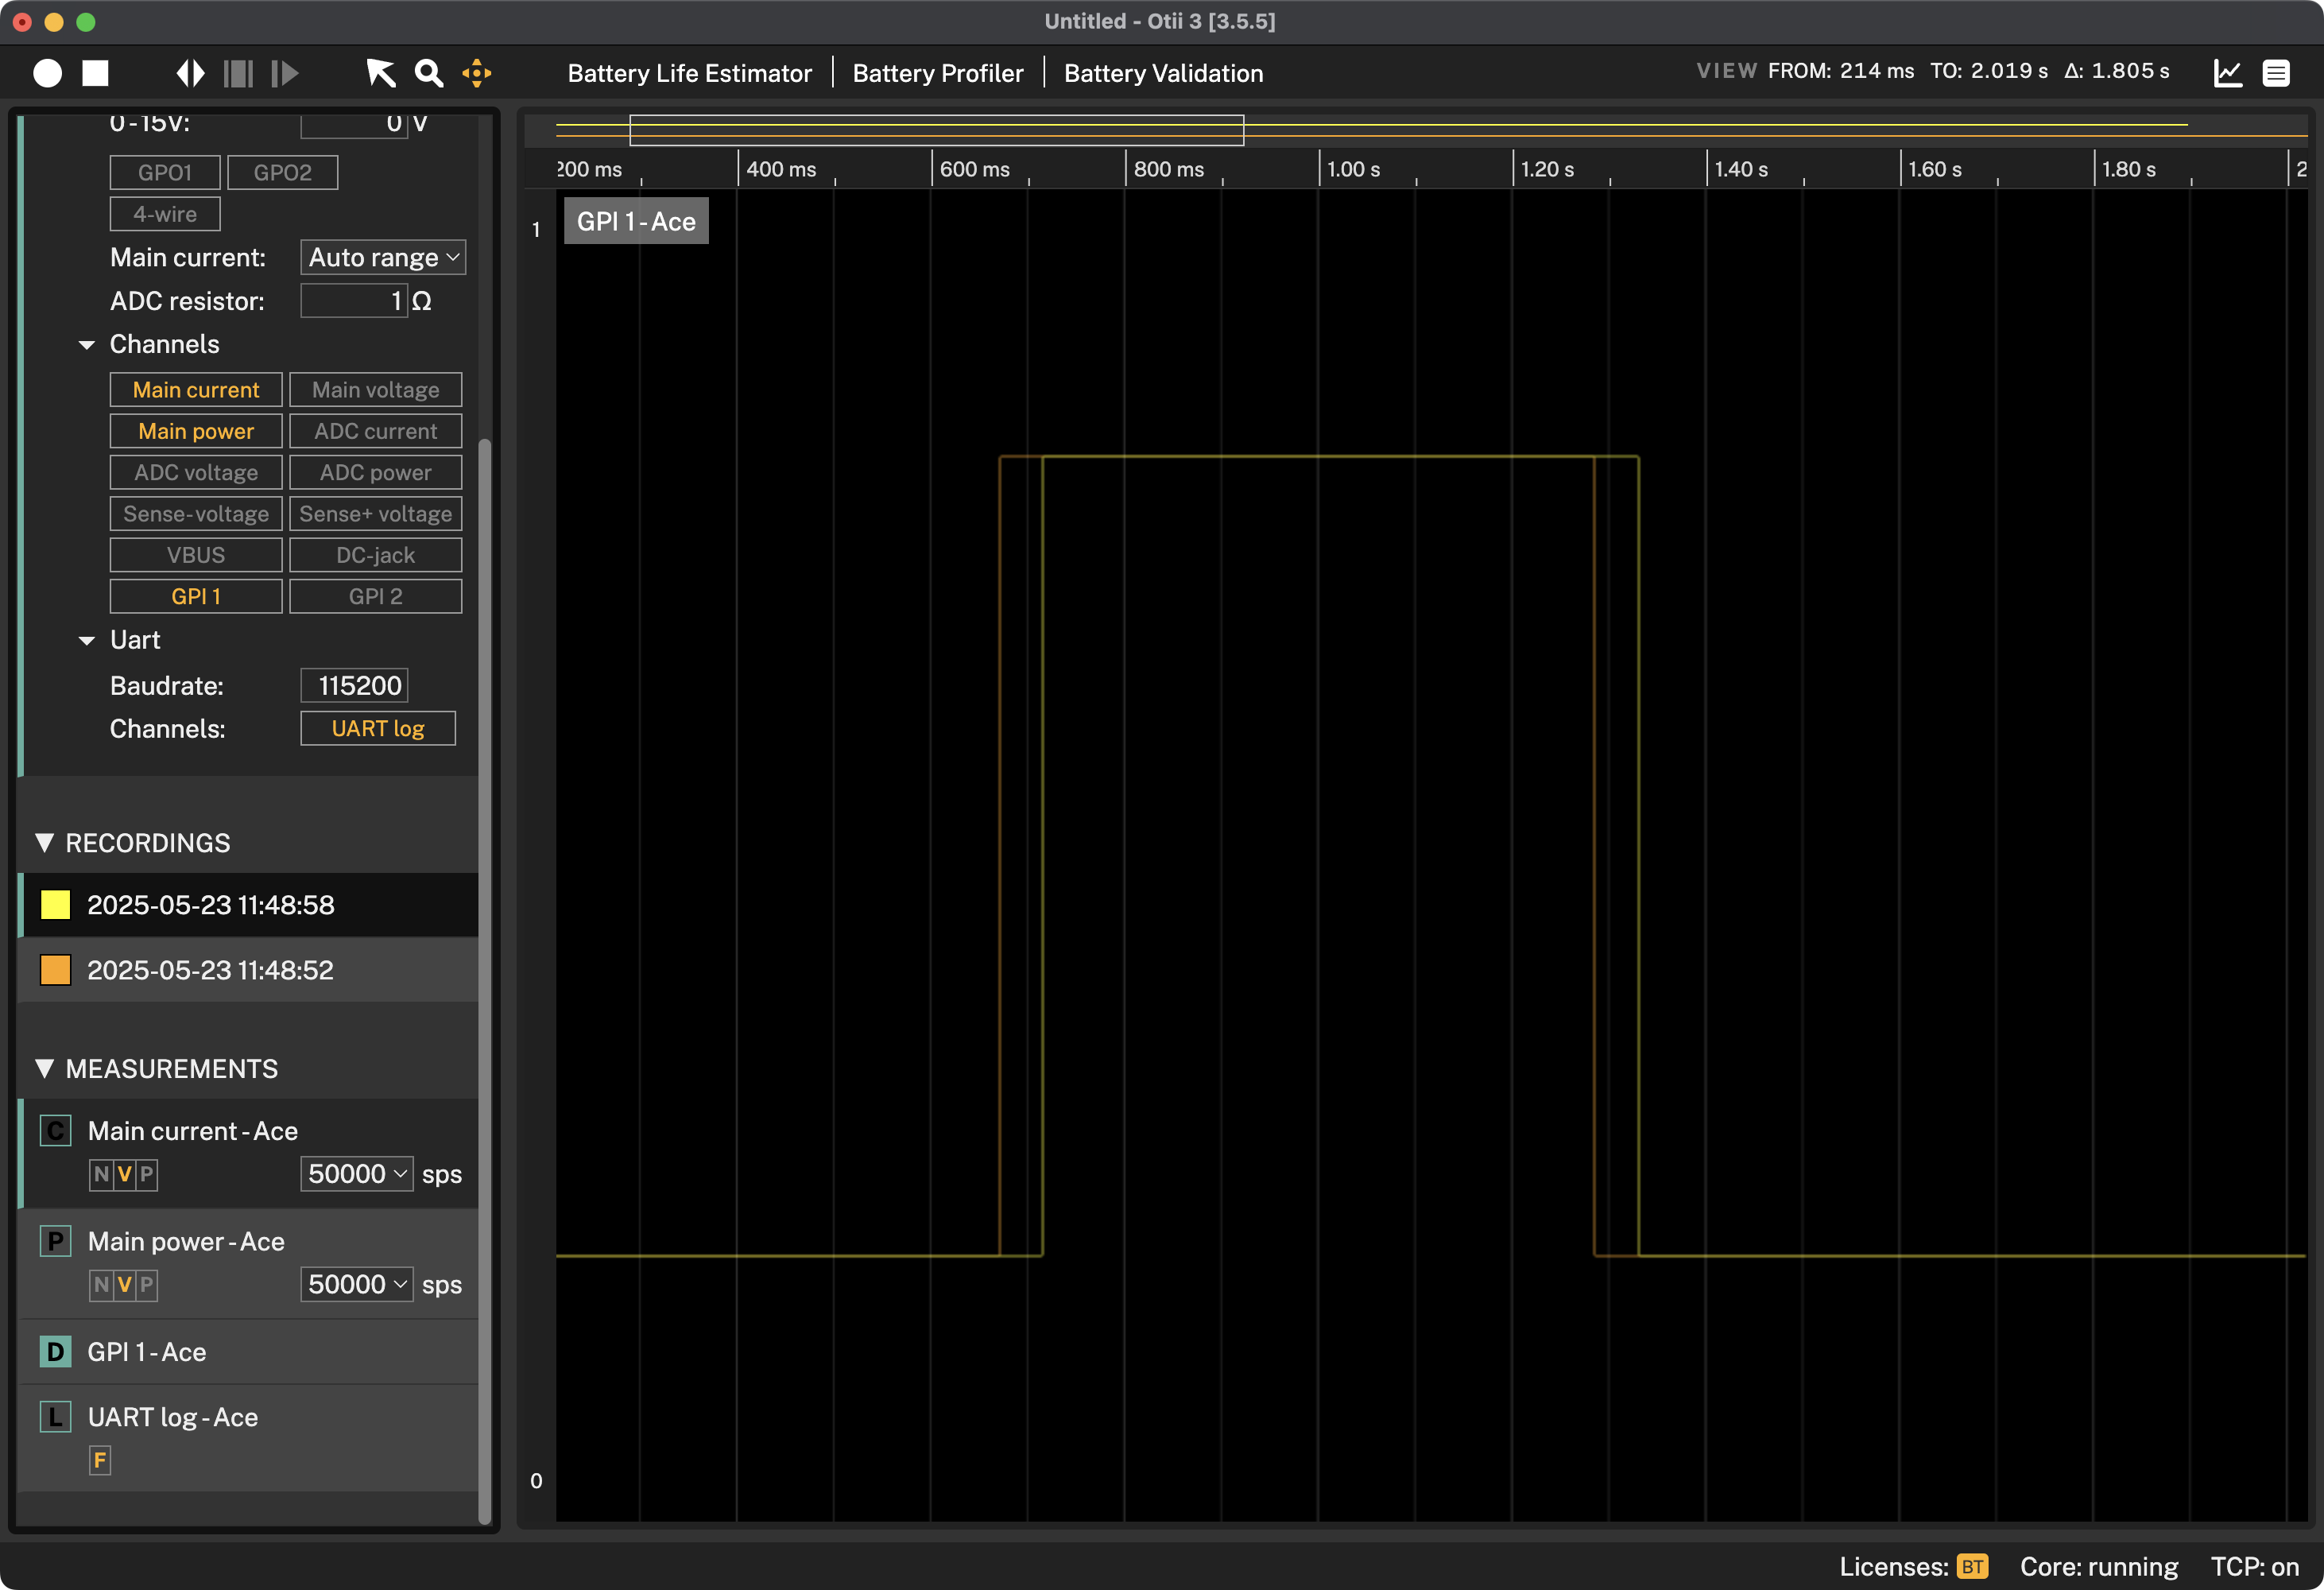
Graph
You can use the graph tools to navigate in the graph and to select data to analyse.
Context menu
The context menu is displayed by right-clicking anywhere in the graph. The following options will be avaible the the analog view:
- Select all: select all data
- Clear selection: clear the current selection.
- Zoom to selection: when having a selection and right-click and select Zoom to selection, then the selection will fill the whole graph. This is the quickest way to zoom to the part that's desired to be analyzed.
- Set time range: according to the channel graph selected, the time range to be evaluated can be adjusted from and to a specific time
- Crop active recordings: the selected recording will be cropped, keeping the selection,
and all other recordings will remain unchanged.
If the undo history hasn't cleared up, the crop can be undone by pressing
Ctrl-Z/⌘-Z - Crop all recordings: this will crop all the recordings, even the recordings
that are not selected, keeping the data within the selection. If the undo history hasn't
cleared up, the crop can be undone by pressing
Ctrl-Z/⌘-Z
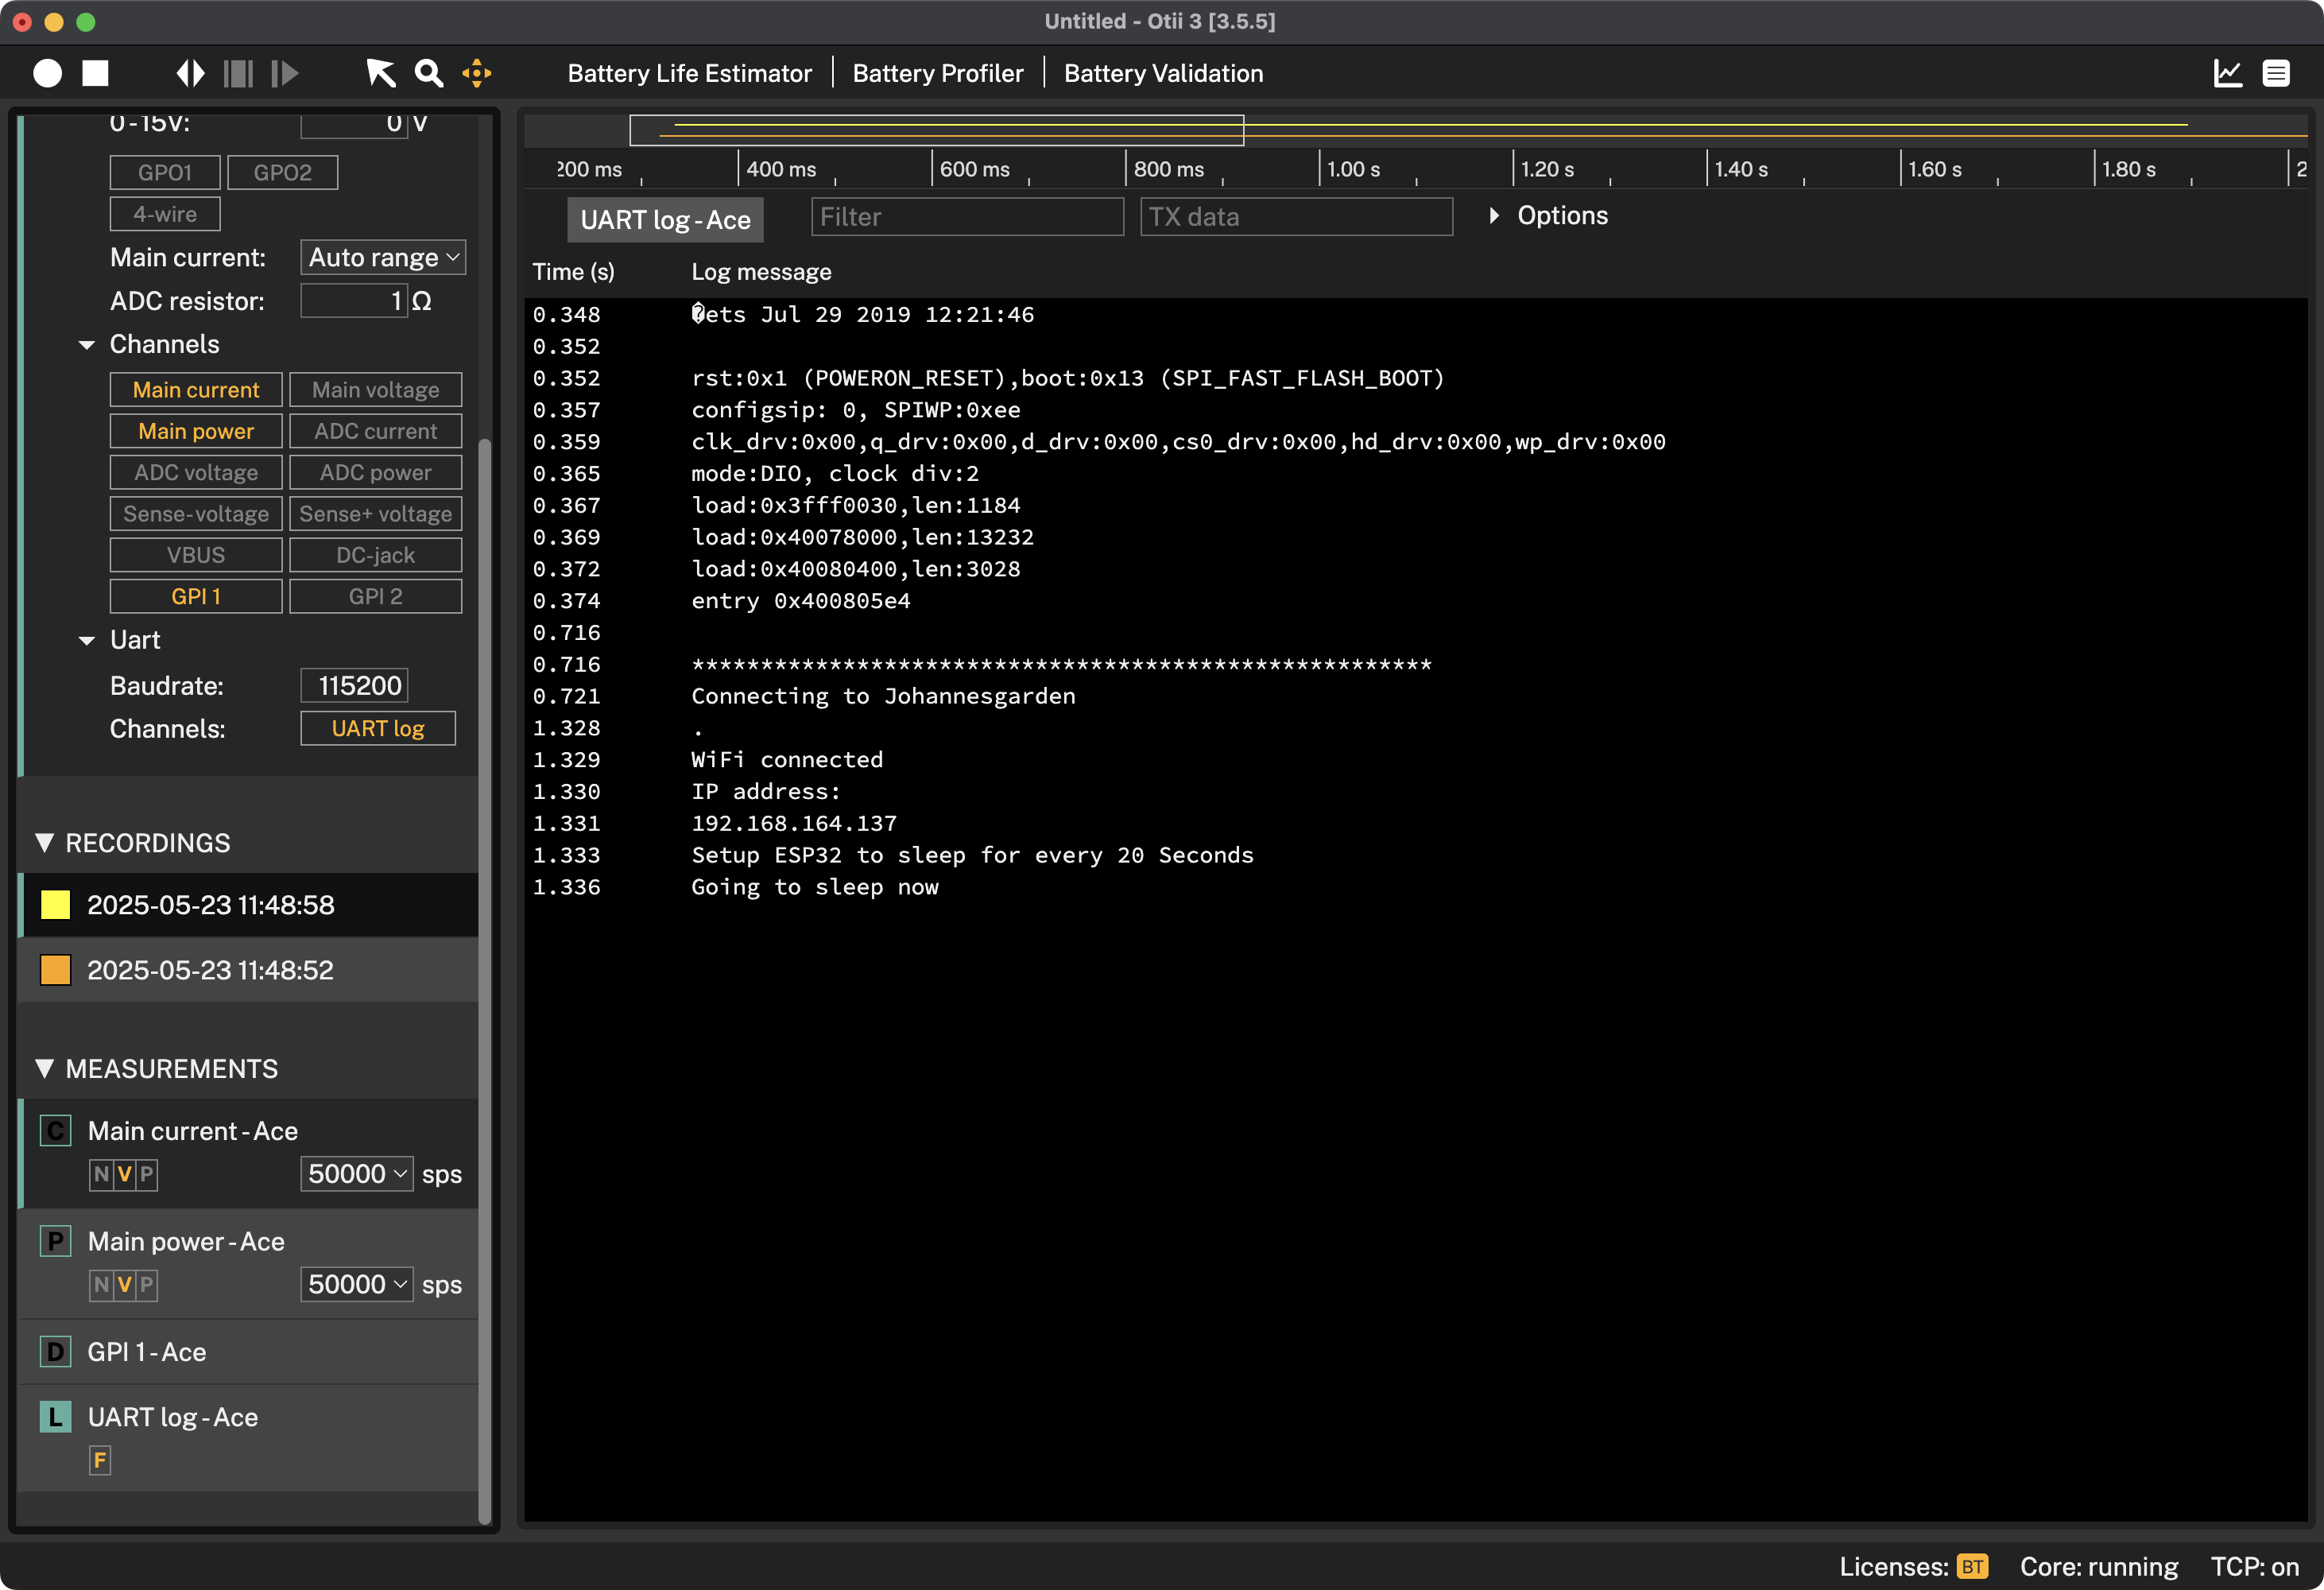
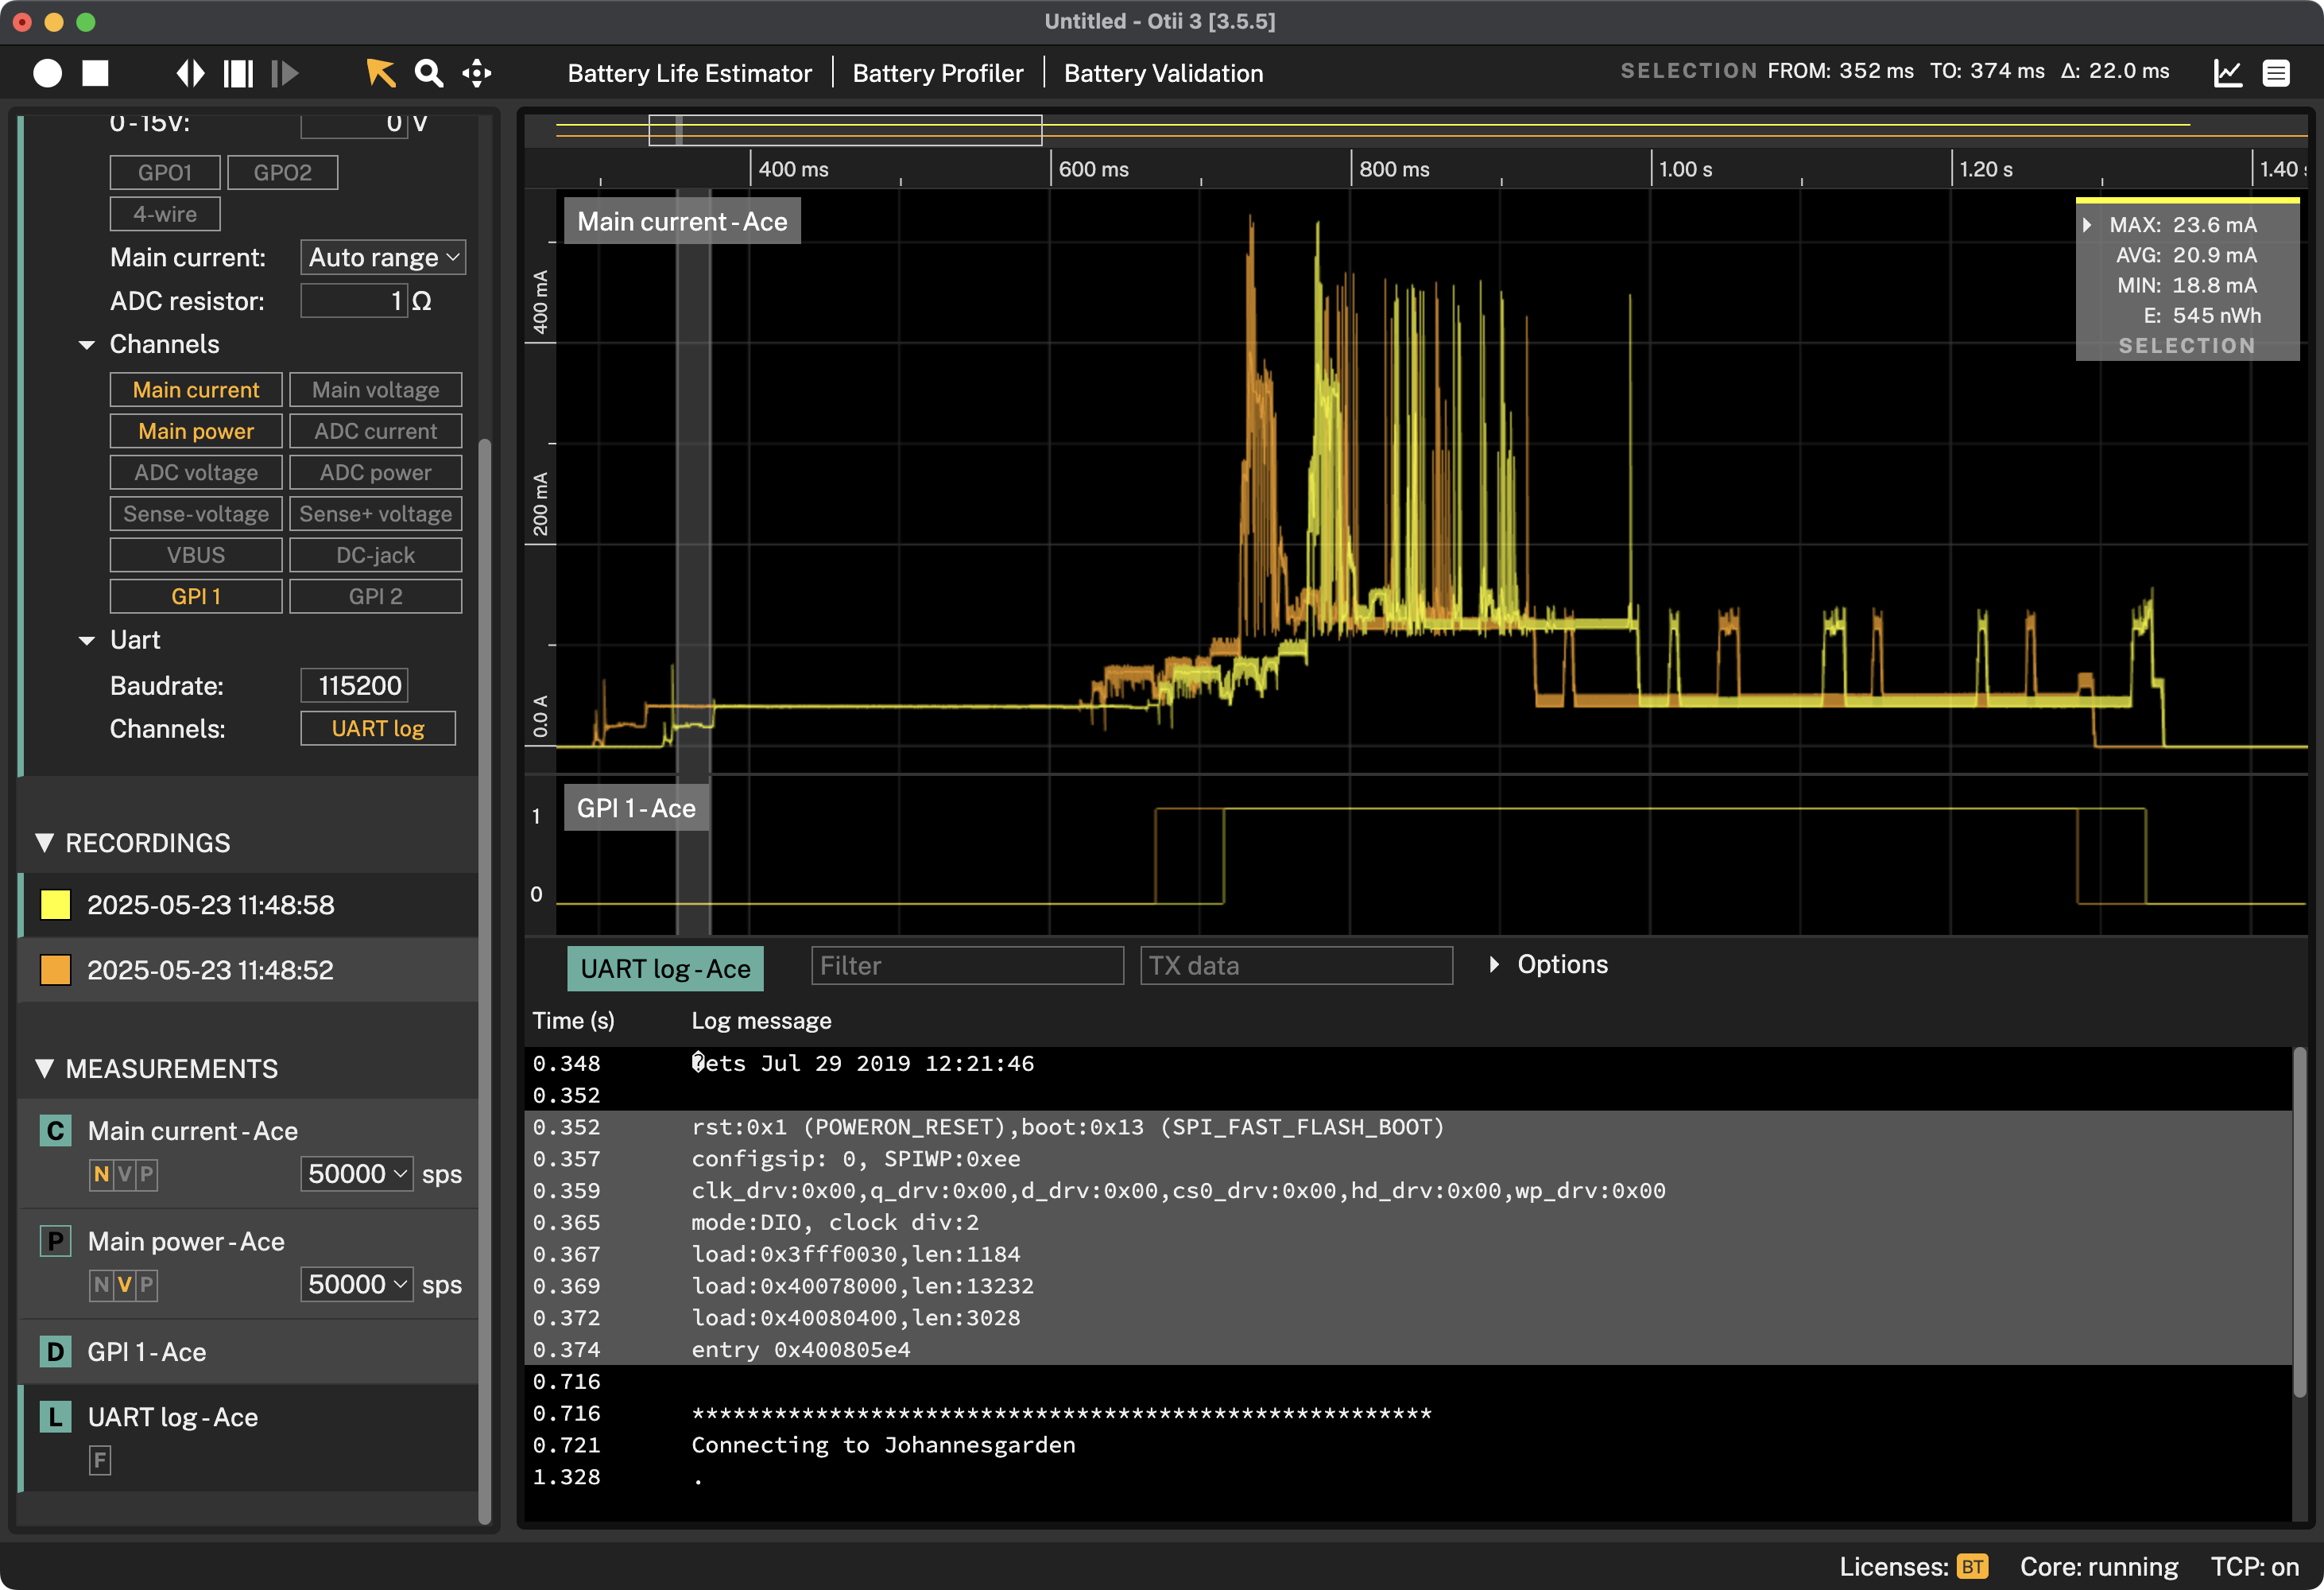
Log
The log viewer shows log data recorded from either the UART pin of the Otii hardware, or from a third party USB UART. The log view only shows data from the active recording.
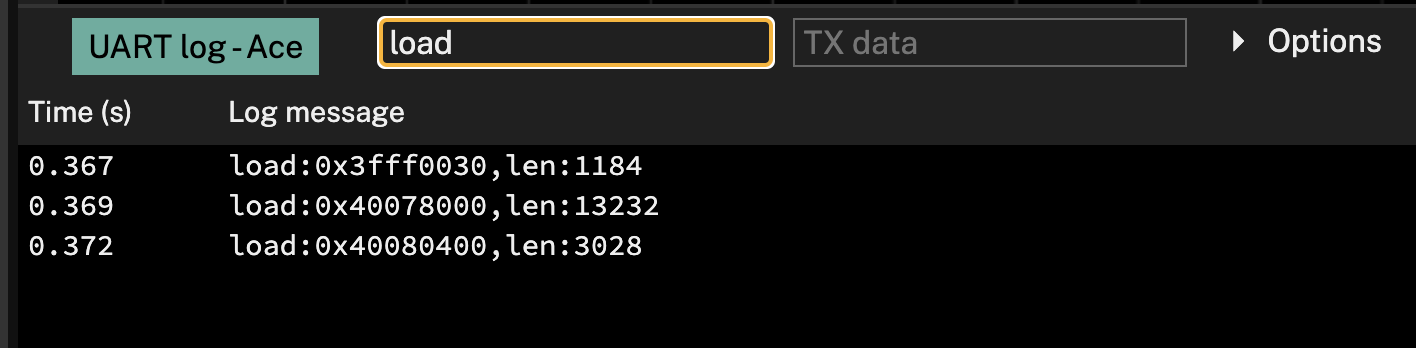
Filter
The Filter field enables filtering the messages logged in the console log. Just write the desired message to be found, and it will filter out the messages that have been logged over time.
TX data
The TX data field transmits data from the console to the DUT. Making it the ideal interface for sending AT commands or customized configurations to the DUT.
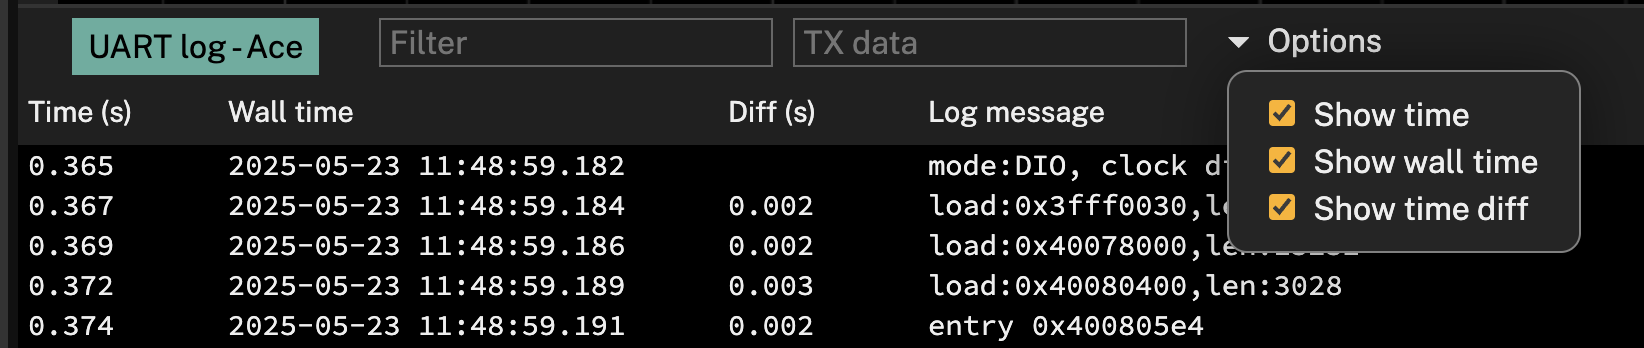
A recording must be active to send the data.Time traceability
Logging time using the console logo is optional. To activate it, click on the options to select what is to be monitored:
- Show time: It shows the execution time since the DUT was switched on
- Show wall time: t shows the date, in YYYYY-MM-DD format, and the time, in HH:MM:SS format, on which the message has been transmitted. The timestamp displayed is based on the time zone configured on the computer.
- Show time diff: Shows the time diff between the log message and the previous log message.
Mark messages
Mark an area in the graph, and all the UART messages that occurred in this time frame are marked in the UART log. You can also do the opposite and mark one or several messages in the UART log. If you select one message, 1 ms will be highlighted on the graph. At the same time, the current graph for that time frame is marked.
 It is possible to select multiple messages using Shift-click or Shift-arrow up/down